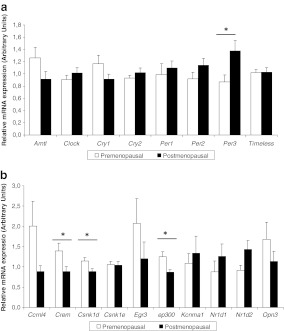
Fig. 1.
Normalised mRNA expression in subcutaneous adipose tissue of the core clock genes (a) and other selected clock-related genes in the (b). The white bars represent gene expression in the premenopausal women while the black bars represent the postmenopausal group. Results are expressed as the mean ± SEM. Statistical significance was calculated using a Student’s t test. *P < 0.05

