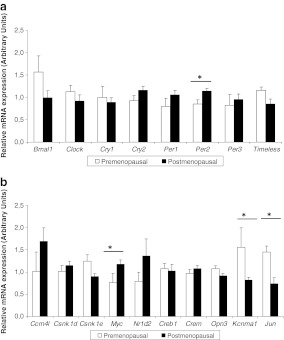
Fig. 3.
Normalised mRNA expression of the core clock genes (a) and other selected clock-related genes in the visceral adipose tissue (b). The white bars represent gene expression in the premenopausal women, while the black bars represent the postmenopausal group. Results are expressed as the mean ± SEM. Statistical significance was calculated using a Student’s t test. *P < 0.05

