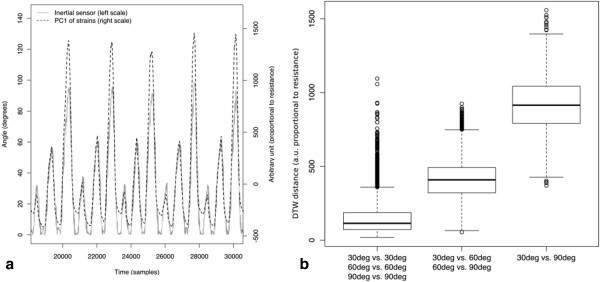
Figure 2.
Acquired data analysis.a) The first principal component of the signals acquired by the 13 CE strain sensors is plotted together with the angle measured by the MEMS inertial sensor, versus time b) the boxplots represent distributions of “DTW distances” between couples of motor tasks, showing, as common, median, quartiles, largest and smallest observations, and outliers. Distances are computed between trunk flexions performed with: 1) the same ROM; 2) 30 degrees ROM difference; 3) 60 degrees difference.

