


Figure 2.
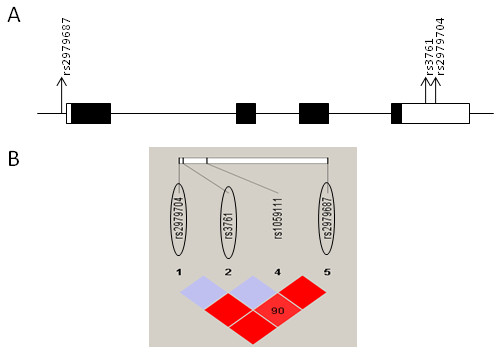
Linkage disequilibrium (LD) plot of NEFL. (A) Genomic structure of NEFL showing the locations of SNPs (denoted by arrows) used in the association study of AGRE samples. Exons are indicated by boxes, with translated regions in closed boxes and untranslated regions in open boxes. (B) LD structure of NEFL in Caucasian samples, based on D′ values. Tag single nucleotide polymorphisms (SNPs) are encircled.