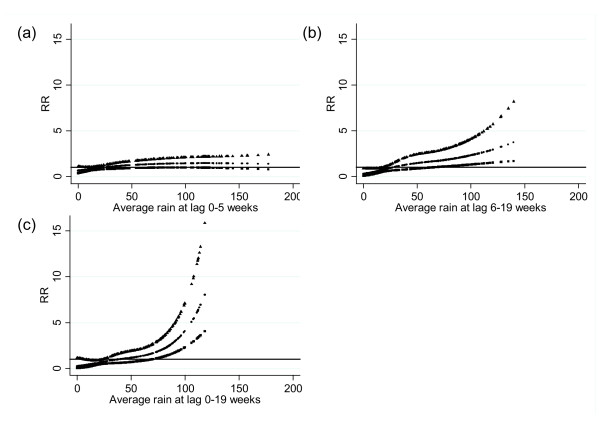
Figure 5 .
Relationship between the number of dengue cases and average rainfall over lags of (A) 0–5 weeks, (B) 6–19 weeks and (C) 0–19 weeks (shown as a 3 df natural cubic spline) adjusted for seasonal variation, interannual variations, public holidays, temperature and river level. RR represents the relative risk of dengue (scaled against the mean weekly number of cases). The centre line in each graph shows the estimated spline curve, and the upper and lower lines represent the 95% confidence limits.

