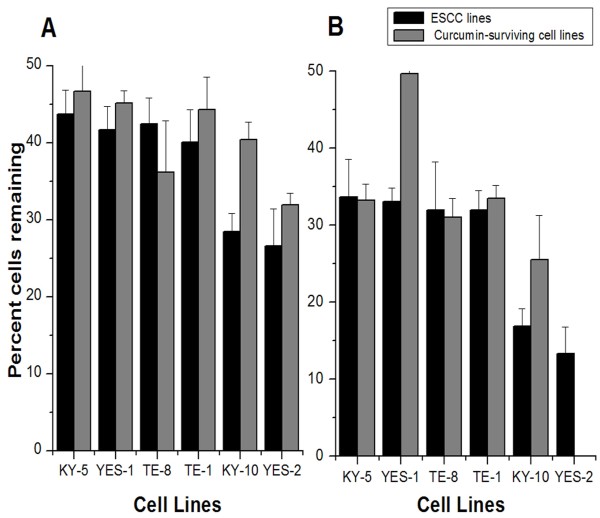
Figure 8.
Effects of curcumin on curcumin-surviving cell lines. Overall, the surviving lines showed a small but significant increase in survivorship to A 40 μM (F=5.132, p=0.031) and B 60 μM (F=8.358, p=0.008) curcumin administered for 30 hrs. Data for the original lines are from Figure 2. Cell lines are arranged by responses of the original lines to 60 μM curcumin. The mean of three experiments ± SD is shown for 40 and 60 μM curcumin.

