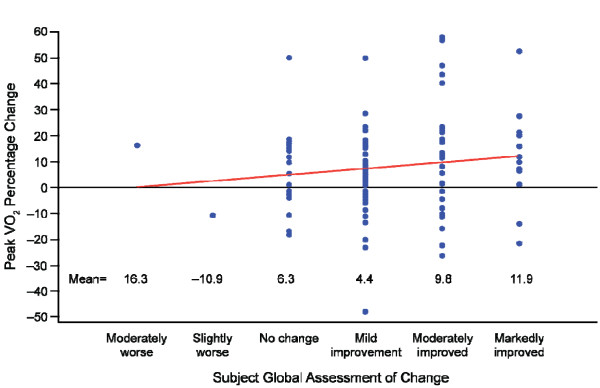
Figure 3.
Relationship of percentage change in peak VO2with the subject global assessment of change. Percentage change in peak VO2 was for baseline to end of treatment values. Subject global assessment of change was responded to at the end of treatment. Note: the linear slope estimate, indicated by the straight line, was 2.2. A sensitivity analysis, which was performed excluding outliers, achieved similar results. VO2 = oxygen consumption.

