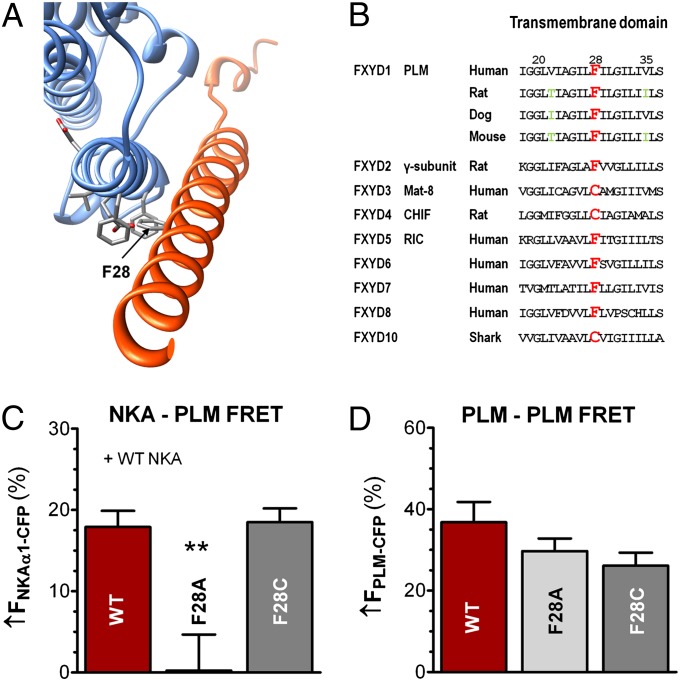
Fig. 2.
Identification and impact of PLM site F28 (opposing site to the NKA–E960 site). (A) NKA structural model with PLM site F28 in stick representation. (B) Transmembrane domain amino acid sequence of FXYDs. F28 is highlighted in red and is naturally cysteine in three FXYDs. Green letters indicate transmembrane variances. (C) NKA–PLM average FRET (±SEM) in HEK293 cells coexpressing WT–NKA and either WT–PLM (n = 20), F28A–PLM (n = 14, P < 0.01), or F28C–PLM (n = 26, P = NS). (D) Mean data of PLM–PLM FRET (±SEM) in control HEK293 cells coexpressing WT–PLM–CFP with WT–PLM–YFP (n = 52), F28A–PLM–YFP (n = 34, P = NS) or F28C–PLM–YFP (n = 24, P = NS).

