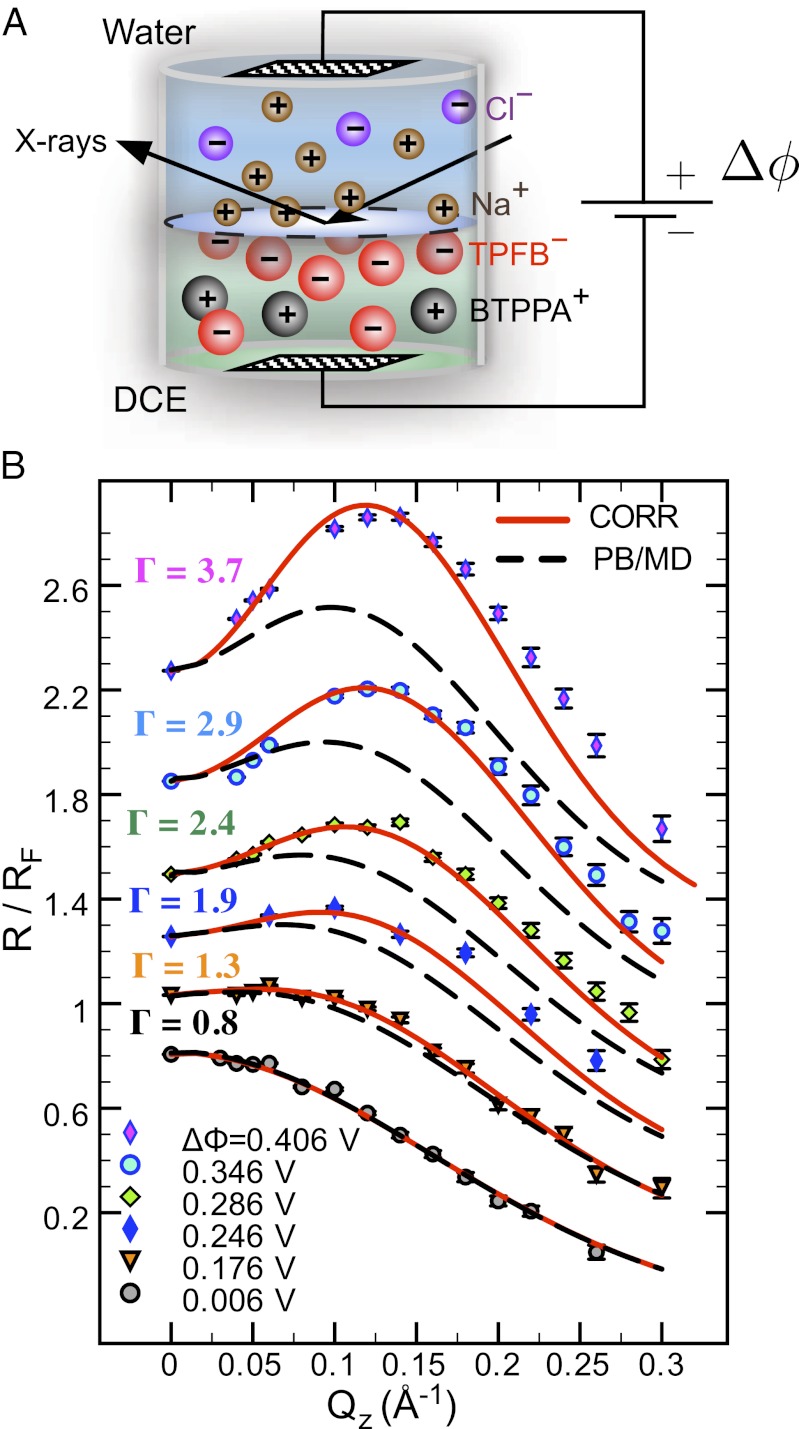
Fig. 1.
(A) Illustration of the electrified aqueous electrolyte/organic electrolyte interface for  , with ions represented by spheres. Arrows represent incident and reflected X-rays. The two grids represent the working electrodes that are ∼1 cm from the liquid/liquid interface; reference electrodes are not shown (10). Electrical double layers (not illustrated) are also formed on the working electrodes. (B) X-ray reflectivity R normalized to the Fresnel reflectivity
  from the electrified water (10 mM NaCl)/DCE (5 mM BTPPATPFB) liquid/liquid interface as a function of wave vector transfer
  (wavelength
  Å; angle of incidence α) for different electric potential differences
  (increasing from bottom to top) and TPFB− interfacial ion–ion correlation coupling strengths
  . Data are offset for clarity (without the offset,
  as
as  ). Data at
  are measurements of the beam transmitted, without reflection through the upper phase. Lines illustrate the reflectivity predicted from a model with (solid lines, CORR) and without (dashed lines, PB/MD) ion correlations.

