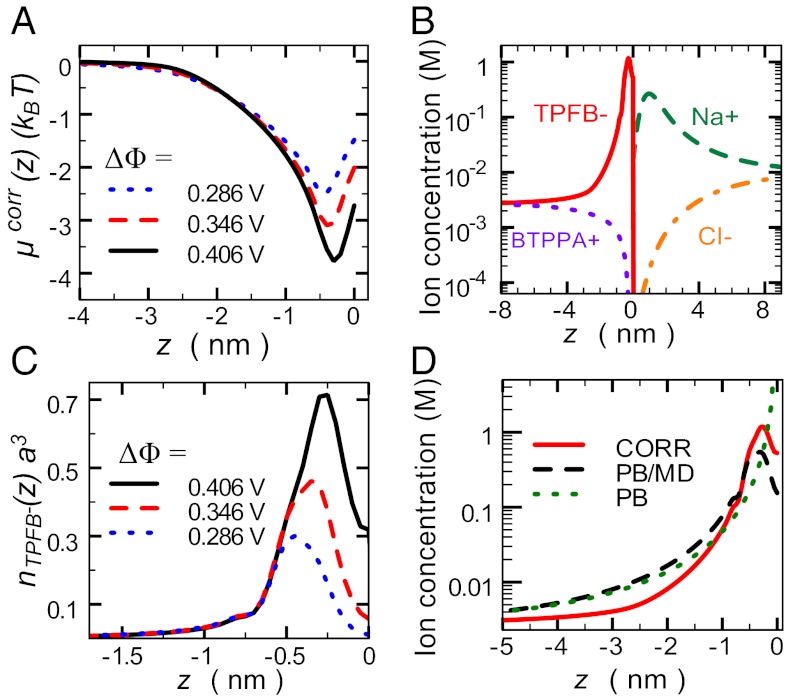
Fig. 4.
CORR model calculations. (A) Excess chemical potential  for TPFB− for three values of
  . (B) Ion distributions at the water (
 )/DCE (
 ) interface illustrate back-to-back electrical double layers at
  in units of molarity. (C) TPFB− number density profile
  times the volume
  , where
  nm is the ion diameter, for three values of
  . (D) Comparison of the PB (Gouy–Chapman), PB/MD (PB plus ion–solvent interactions), and CORR (PB/MD plus ion–ion correlations) models for the TPFB− ion concentration (in molarity units) near the interface at
  .
.

