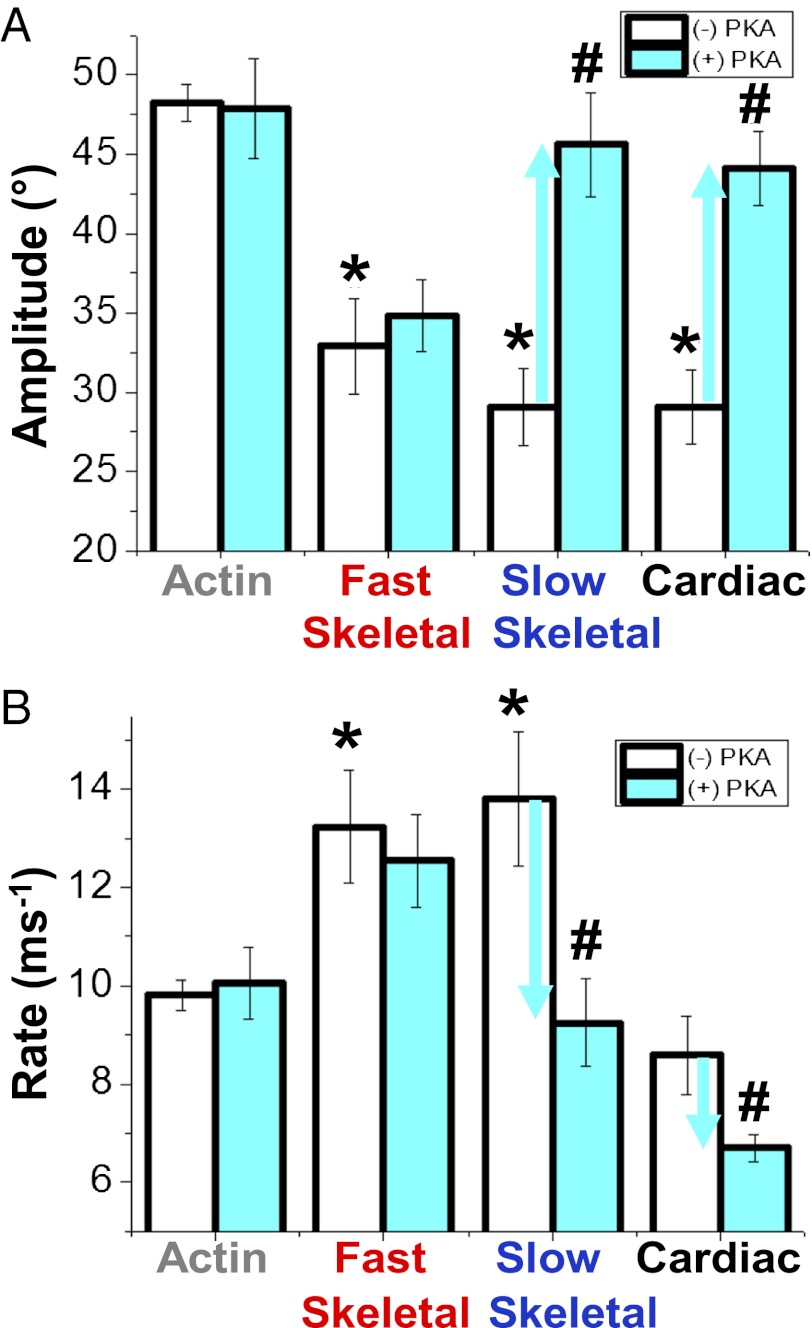
Fig. 2.
(A) Final anisotropy of actin (Fig. 1) as a function of the fraction bound to isoforms of MyBP-C. Effects in the absence (white bars) and presence (cyan bars) of PKA-mediated phosphorylation on the angular amplitudes (B, Eq. 3) and rates (C, Eq. 4) of actin torsional dynamics (Fig. 1A) at saturation. *Significant change in absence of PKA treatment compared to actin alone (P < 0.05). #Significant change due to PKA treatment (P < 0.05).

