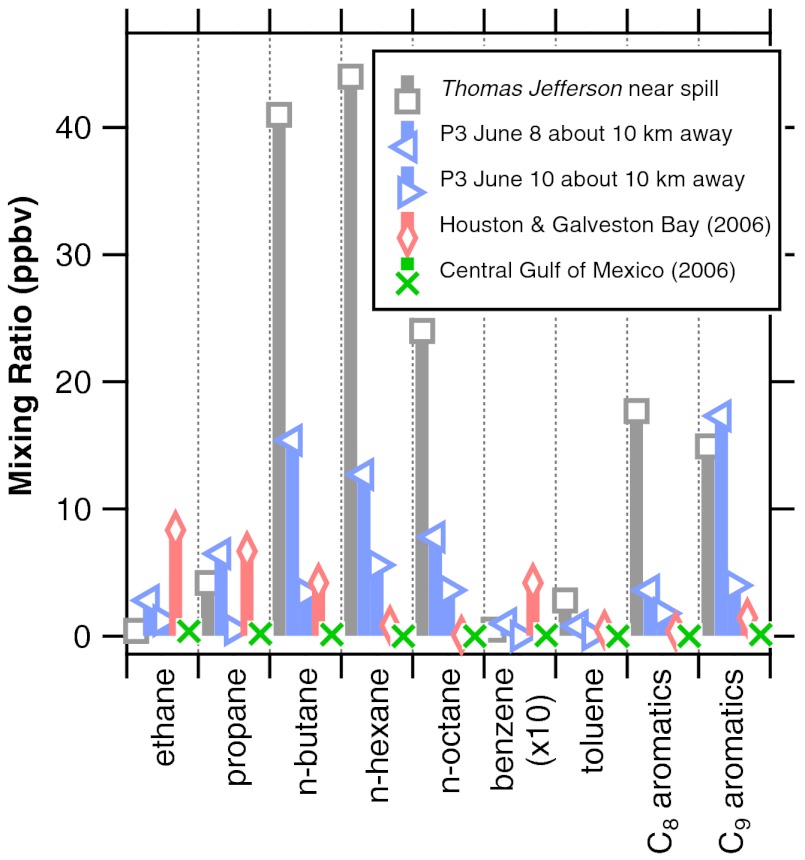
Fig. 3.
Average selected hydrocarbon mixing ratios obtained from the NOAA ship Thomas Jefferson on June 22–27, 2010 within a 10 km radius of the DWH site and from the NOAA P3 aircraft on June 8 and 10, 2010 at a distance 10 km downwind. Houston/Galveston Bay and unpolluted, central Gulf of Mexico data were obtained from another NOAA ship in 2006 (5).

