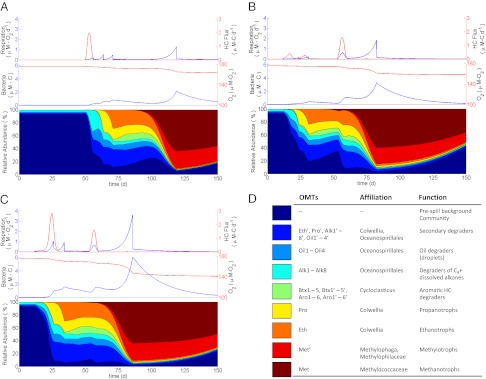
Fig. 2.
Comparison of microbial community dynamics in water parcels with different exposure histories, all starting April 23, 2010. (A) Time course change in hydrocarbon flux (red) and respiration rate (blue) shown in Top, dissolved oxygen concentration (red) and bacterial abundance (blue) shown in Middle, and relative composition of the microbial community shown in Bottom for a parcel experiencing a single exposure. (B) Time course changes as described for A for a parcel experiencing a triple exposure. (C) Time course changes as described in A for a parcel experiencing a double exposure. (D) Tabulated legend identifying the OMTs, their putative phylogenetic affiliation, and their ecosystem function.

