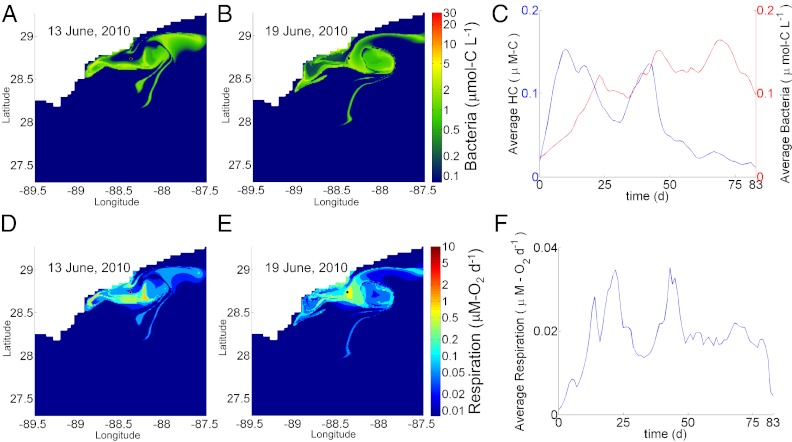
Fig. 3.
Impact of recirculation on hydrocarbon abundance, bacterial population, and metabolism. (A and B) Spatial distribution of bacterial abundance before (A) and during (B) the early stages of an autoinoculation event. (C) Time course change in average abundance for bacteria consuming nonmethane hydrocarbons and the average summed concentration of these chemicals integrated over the computational domain. (D and E) Spatial distribution of hydrocarbon respiration rate before (D) and during (E) the early stages of the same autoinoculation event. (F) Time course change in the average respiration rate for bacteria consuming nonmethane hydrocarbons, integrated over the computational domain. Because the size of the computation domain is 2° latitude × 2° longitude, a small number of parcels exit the domain near the end of the simulation.

