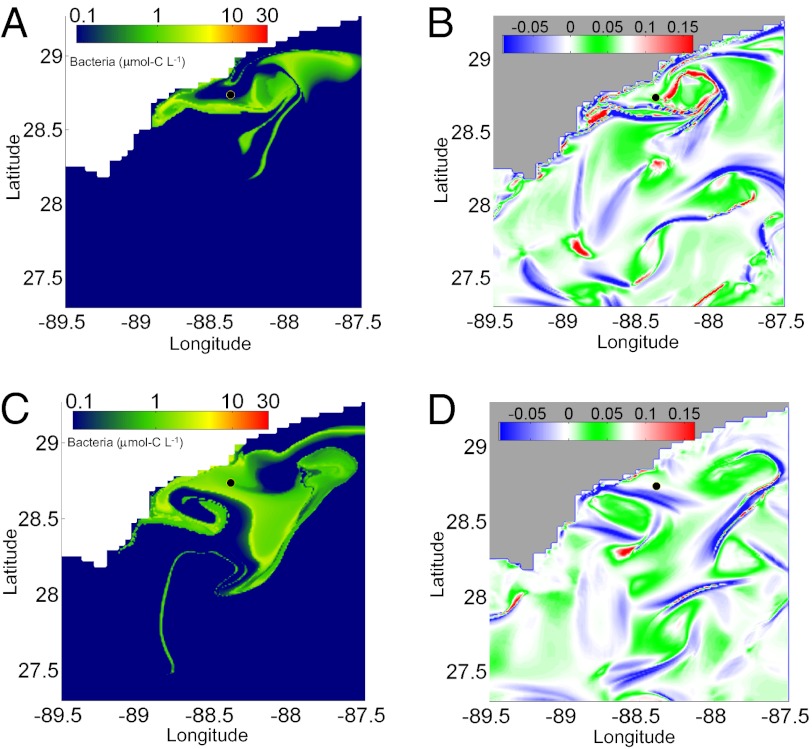
Fig. 4.
Comparison of physical and biological features. (A) Spatial distribution of bacterial abundance on June 13, 2010. (B) Hypergraph map on June 13, 2010. (C) Spatial distribution of bacterial abundance on June 30, 2010. (D) Hypergraph map on June 30, 2010. For the hypergraphs, blue indicates mesohyperbolic regions, red indicates mesohyperbolicity with shear, and green indicates elliptic regions in which eddies are formed. The scaled units for the hypergraphs are defined in ref. 16.

