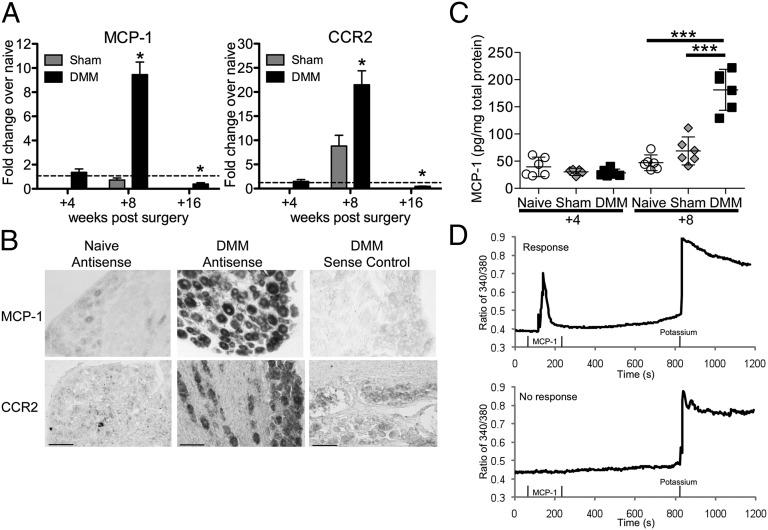
Fig. 1.
MCP-1/CCR2 gene and protein expression in DRG is elevated 8 wk after DMM surgery. (A) Real-time RT-PCR of Mcp-1 and Ccr2 in sham and DMM wild-type mice normalized to age-matched naïve levels: at 4 wk postsurgery, n = 5, two-tailed t test, P > 0.05; at 8 wk postsurgery, n = 4 for naïve, n = 5 for sham and DMM, one-way ANOVA with Bonferroni posttest, MCP-1: *P < 0.001 vs. sham and naïve, CCR2: *P < 0.001 vs. naïve, and P < 0.01 vs. sham; at 16 wk postsurgery, n = 4 for naïve, n = 7 for DMM, two-tailed t test *P = 0.01 for MCP-1 vs. naïve, *P = 0.003 for CCR2 vs. naïve. Results show mean ± SEM. (B) Representative images of in situ hybridization using antisense probes for MCP-1 and CCR2 in DRG sections (L3–L5) taken from DMM wild-type mice at 8 wk postsurgery and age-matched naïve mice. Sense probe control is shown for the DMM condition. Magnification 10×. (Scale bars, 100 μm.) (C) Protein levels of MCP-1 in the supernatants of cells cultured from age-matched naïve, sham, and DMM mice at 4 and 8 wk postsurgery, n = 6 wells, representative of two independent experiments, one-way ANOVA with Bonferroni posttest, ***P < 0.001. Results show mean ± 95% confidence interval. (D) Representative traces of individual cells during calcium mobilization assay indicating a response to MCP-1. Response to 50 mM potassium solution, used as a positive control, is also shown.

