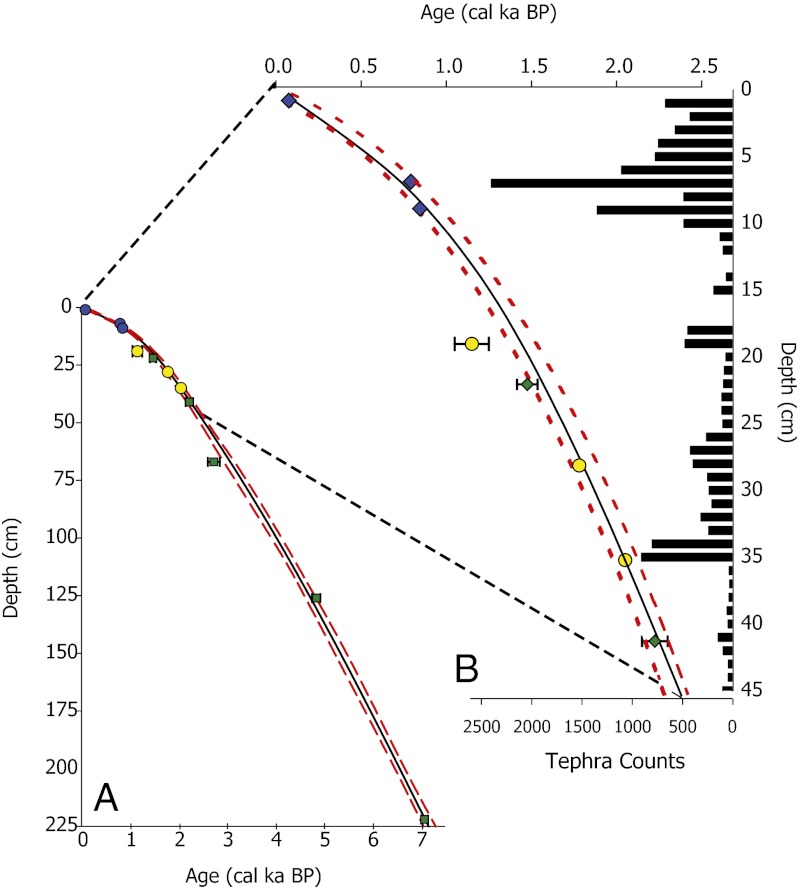
Fig. 2.
(A) Age–depth model for the composite core record covering the last 7.5 ka. (B) Expanded view of the last 2.5 ka. The solid black line is the best-fit spline generated by the CLAM age–depth model (46); the red dashed lines above and below the best fit are the 95% minimum and maximum confidence limits, respectively. Radiocarbon dates are represented by the green diamonds and the error bars are the 2-σ ranges. Tephra ages used in the age–depth model are represented by blue diamonds; tephras not used in the age–depth model are represented by yellow circles. The histogram of tephra grain counts (Right) shows the relative concentration of tephra shards identified by microscopy.

