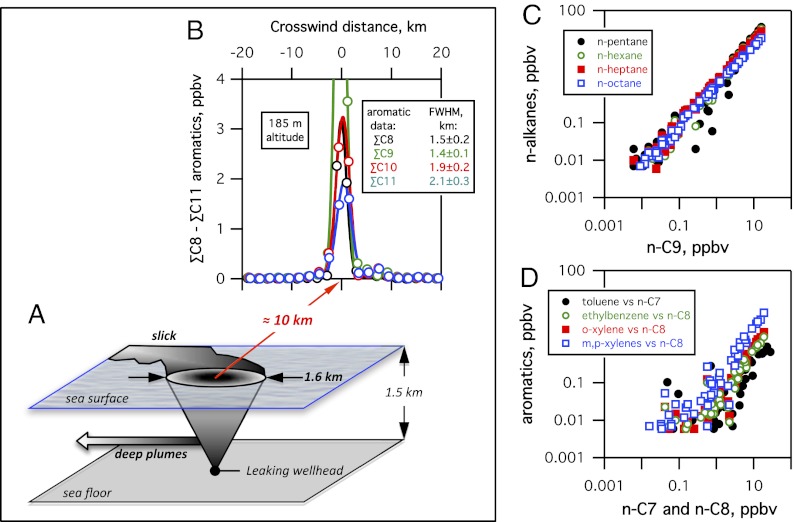
Fig. 1.
(A) Scale diagram of surfacing hydrocarbon plume dimensions; the atmospheric plume data are consistent with a surface source area of ∼1.6 km in diameter. ppbv, parts per billion by volume. (B) Gaussian fits to hydrocarbon composition data and corresponding full width at half maximum (FWHM) from crosswind P-3 aircraft transects of the evaporating plume 10 km downwind of DWH; data from a single transect are shown as an example. (C) Data above the detection limit [>5 parts per trillion by volume (pptv)] from all DWH plume transects show no evidence for different populations of n-C4 through n-C8 alkanes relative to n-C9 (different volatilities and solubilities). (D) Data >5 pptv from all transects show no evidence for different populations of C7 and C8 aromatics relative to n-alkanes of the same carbon number (similar volatilities but different solubilities).

