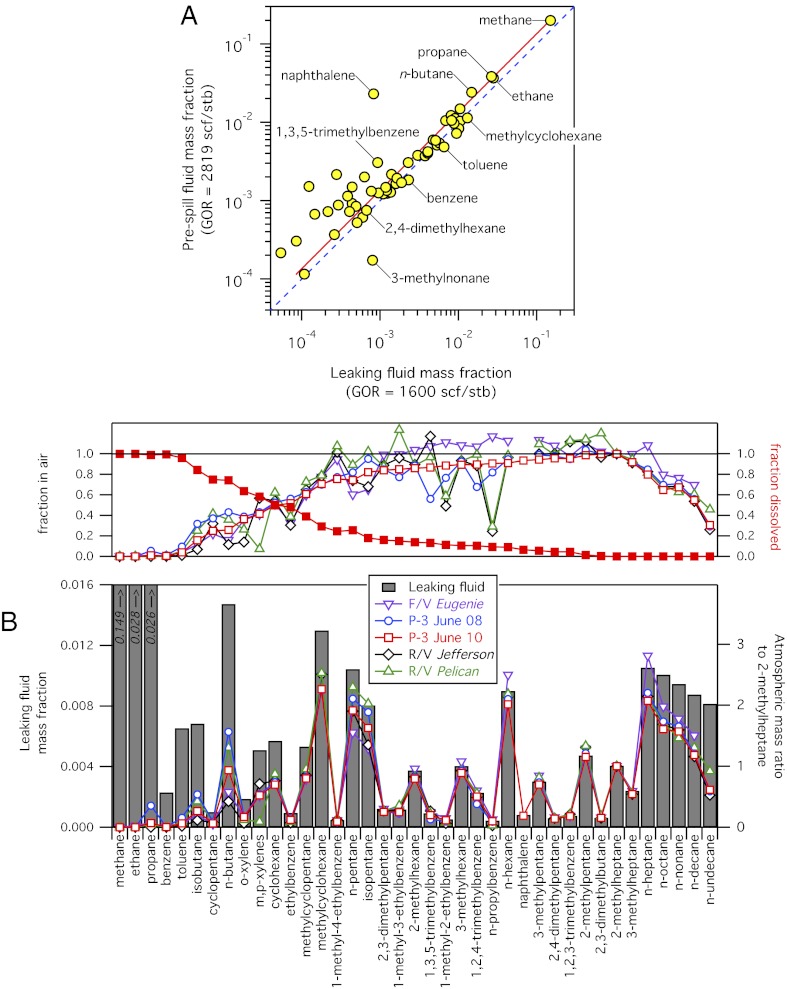
Fig. 2.
(A) Prespill Macondo reservoir hydrocarbon mass fraction (mass of compound per mass of reservoir fluid) (2) plotted vs. leaking fluid hydrocarbon mass fraction measured during the spill in mid-June (5). Each data point represents an individual hydrocarbon compound; several are labeled for illustration. Data for methane (CH4) through n-undecane (C11H24) are shown, comprising 38% of the total mass of the leaking fluid. The dashed line (blue) has a slope of unity; the slope of a linear-least-squares fit (red) is, within estimated errors, not significantly different from unity. Gas-to-oil ratio (GOR) data are given in units of standard cubic feet per stock tank barrel (scf/stb). (B) (Lower) Atmospheric hydrocarbon mass enhancement ratios to measured 2-methylheptane (open symbols) from research vessels and aircraft reflect the undissolved and volatile components of the leaking fluid (gray bars). (Upper) Fractions in air (open symbols) are the atmospheric enhancement ratios normalized to the expected ratio to 2-methylheptane in the leaking fluid. The dissolved fraction (filled squares) is calculated from the data from June 10, 2010.

