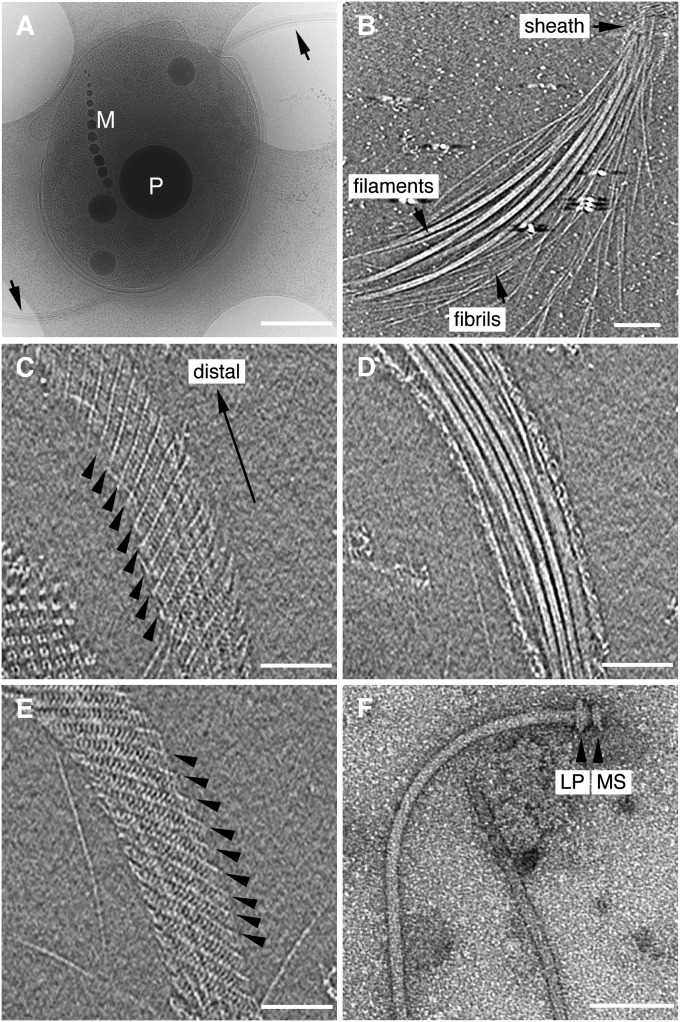
Fig. 1.
CryoEM observation of an MO-1 cell and its flagellar apparatus. (A) CryoEM image of a vitrified MO-1 cell showing two flagellar apparatus (arrows). A phosphorous oxygen-rich granule is labeled P, and magnetosome crystals are labeled M. (Scale bar, 500 nm.) (B) A slice of a tomogram showing the distal end of a flagellar bundle where flagellar filaments and fibrils are exposed out of the sheath. (Scale bar, 100 nm.) (C–E) Three slices of a tomogram showing the structure of the sheath and the bundle of flagella and fibrils within it. The slice distance is 30.7 nm from C to D and 16.5 nm from D to E. (C) Lower surface of the sheath. (D) Middle section of the bundle. (E) Upper surface of the sheath. Arrowheads in C and E indicate the helical lines of the sheath. (Scale bars, 100 nm.) (F) Negatively stained EM image of an isolated filament-hook-basal body complex. The L, P, and MS rings are indicated. (Scale bar, 100 nm.) The tomogram was reconstructed from a tilt-series of cryoEM images over a range of ± 62°, with an increment of 2°.

