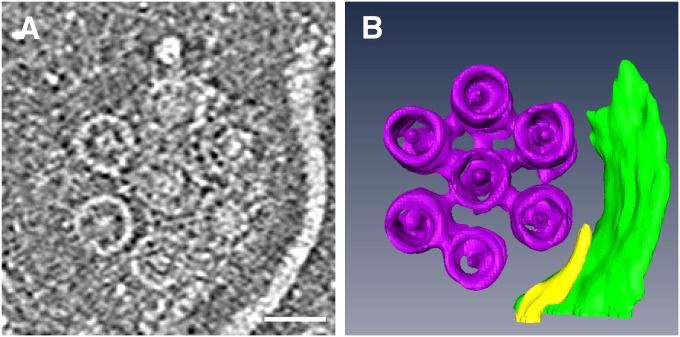
Fig. 4.
Structure of the flagellar basal body around the cytoplasmic membrane of isolated base platform. (A) Slice showing seven large rings, each with a central core density. (Scale bar, 50 nm.) (B) Solid surface rendered by 3D segmentation of the tomogram. The tomogram was reconstructed from a tilt-series of cryoEM images in a range of ± 62° with an increment of 2°.

