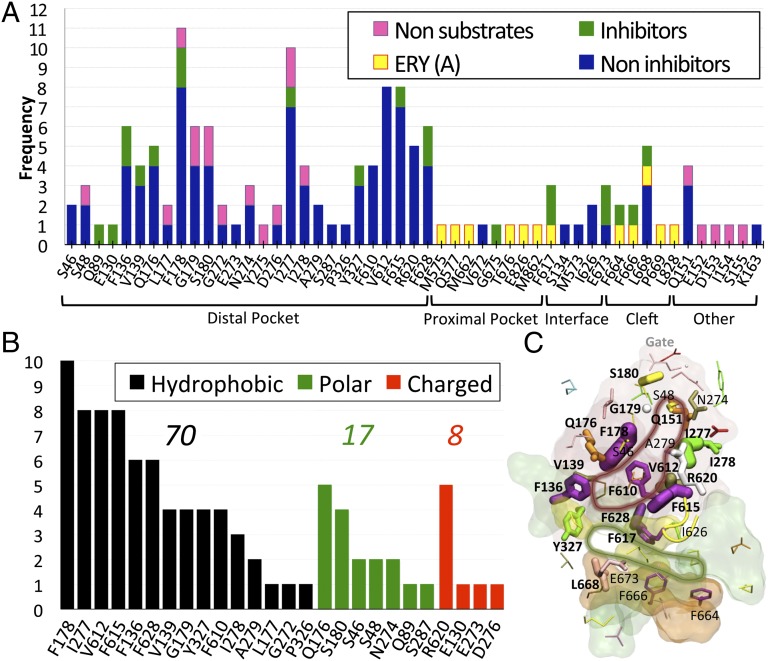
Fig. 4.
(A) Frequency of contribution to the binding free energy from different residues belonging to the key regions defined in Fig. 1 and from additional residues. Only residues contributing with more than kT (∼0.6 kcal/mol at 310 K) are reported. Amino acids shared among different regions are reported only in one. The residues belong to the binding monomer for all complexes but ERYA, where they belong to the access monomer. (B) Frequency of contribution to the binding free energy of substrates (thus excluding GLC and KAN) by hydrophobic (black bars), polar (green), and charged (red) residues. Above each group is the sum of all frequencies. (C) Residues are shown with sticks, whose width is proportional to the frequency of binding contacts to ligands. In red, green, orange, and yellow transparent surfaces are shown the distal and proximal pockets, the entrance cleft, and the distal/proximal interface, respectively. The tip of the G-loop is also shown in yellow cartoon. The residues having frequency of contribution to binding larger than three (considering substrates and nonsubstrates of the transporter) are also labeled. Bold labels refer to residues whose frequency of contribution to substrates (inhibitors or not) is larger than three. The red and green lines highlight the distal and proximal pockets, respectively, drawn according to this analysis.

