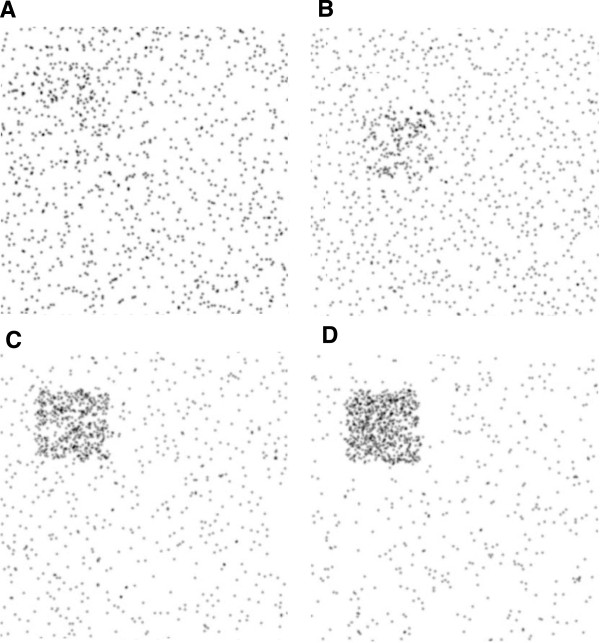
Figure 6.
Particles maps. Position map of particles for A) ε = 0 and r = 2, B) ε = 500 and r = 2, C) ε = 4000 and D) ε = 10000. Note that the actual values of ε are scaled down by 10–12. See also supporting Additional file 1: Video S1, Additional file 2: Video S2, Additional file 3: Video S3 and Additional file 4: Video S4 for r∈{2,10} and ∈∈{0,1e5}.

