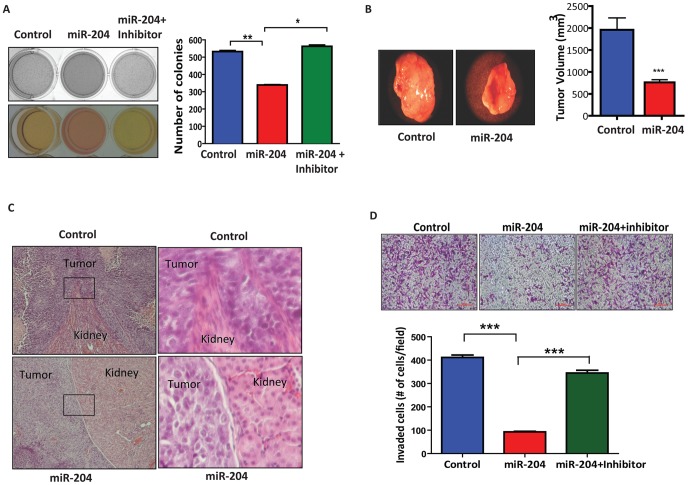
Figure 2. MiR-204 inhibits tumor growth and metastasis.
A, miR-204 inhibits anchorage-independent growth. Nutrient consumption (left) and graph (right) depict the number of colonies formed in soft agar wells by HEK-293 cells stably overexpressing either scramble or miR-204, further transfected with miR-204 inhibitor. (*) P<0.05; (**) P<0.01. Results are the average of three independent experiments. B, miR-204 overexpression inhibits tumor growth. Photograph shows representative features of tumor growth in RAG2 −/−, γc−/− SCID mice injected (in the kidney capsule) with HEK-293 cells stably overexpressing either scramble control or miR-204. Bar graph shows mean tumor volume for miR-204 (n = 9) and scramble (n = 9) transfectants. (*) P<0.001. C, histological analysis of sections from tumor xenografts overexpressing either scramble (control) or miR-204. Images shown in the right panel represent magnified view of boxed region indicated in the left panel. Tumor invasion in control transfectants is reflected by the invasion of tumor into renal tissue. D, basement membrane matrix invasion assay of MDA-MB-231 cells transfected with 75 nM scrambled sequence (control) or miR-204 mimic (miR-204) or miR-204 mimic transfected cells further transfected with miR-204 inhibitor (miR-204+inhibitor). Bar graph shows the average number of invaded cells counted microscopically in five different fields per filter. (***) P<0.001.

