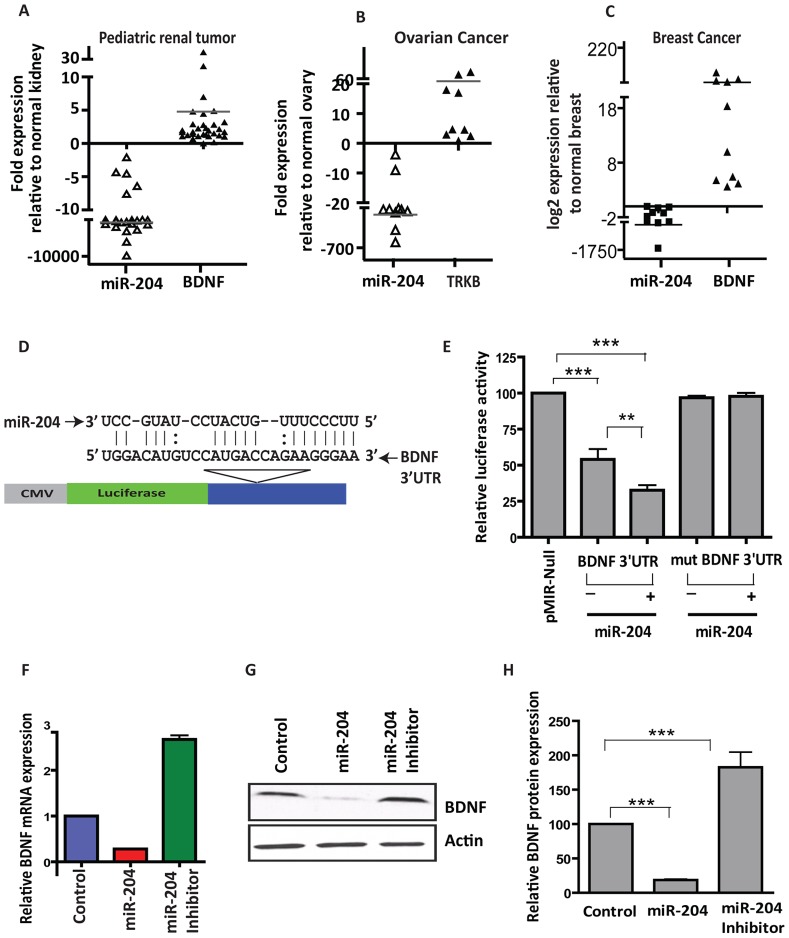
Figure 4. MiR-204 regulates expression of BDNF in cancers.
A–C, increased BDNF expression correlates strongly with lower miR-204 expression in multiple cancers. Graphical representation of qRT-PCR analysis showing the inverse correlation between miR-204 and BDNF in pediatric renal tumors (n = 38; A), advanced stage ovarian cancers (n = 11; B) and breast cancers (n = 10; C), compared to normal matched control kidney (n = 38), normal ovarian tissues (n = 5) and normal matched breast tissues (n = 10). D–H, BDNF is a bonafide target of miR-204. D, schematic of the putative miR-204 binding sequence in the BDNF 3′ UTR. E, HEK-293 cells were co-transfected with Renilla luciferase expression construct pRL-TK and firefly luciferase constructs containing either pMIR-BDNF 3′ UTR in the absence and presence of miR-204 mimic or pMIR-BDNF 3′ UTR mutant. Firefly luciferase activity of each sample was normalized to Renilla luciferase activity. Mean±SEM of three independent experiments (performed in duplicate for each experiment). (**) P<0.01; (***) P<0.001. F, qRT-PCR analysis of miR-204 overexpressing cells and cells transfected with miR-204 inhibitors using BDNF-specific primers. G, western blot analysis of HEK-293 cells transfected with miR-204 mimic using anti-BDNF antibody (1∶1000). β-actin was used as a loading control. Gel photographs are representative of three independent experiments. H, graphical representation of band intensities quantified using the Total Labs TL100 1D gel analysis software (n = 3; Nonlinear). BDNF protein level for the control was set to 100.

