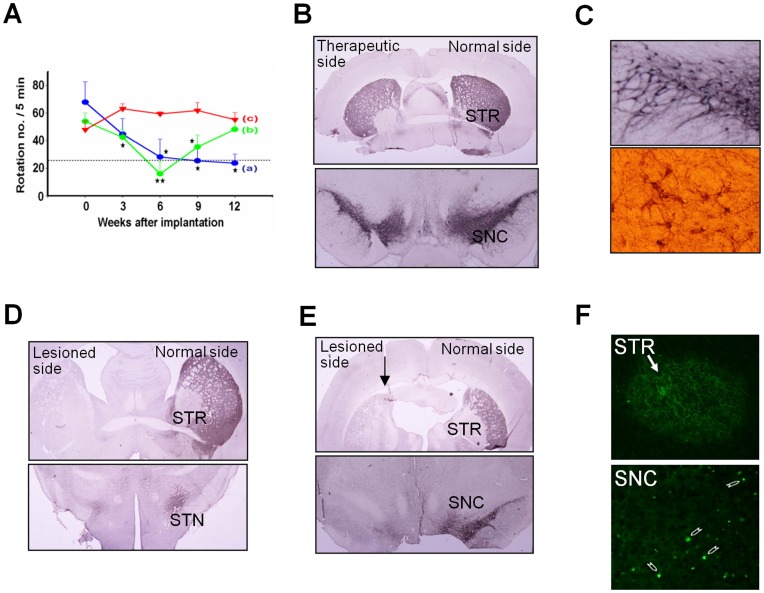
Figure 5. Transplantation of tNSCs in Acute PD Rats.
(A) Apomorphine-induced rotation tests. Group (a) (blue line, n = 4) received 1-day RA-induced tNSCs. Group (b) (green line, n = 4) received 5-day RA-induced NSCs. Group (c) indicated control (red line, n = 4). Statistic analysis by repeated measure ANOVA: p-value = 0.001. LSD post hoc comparisons after repeated measure ANOVA in between two groups: *: p<0.05; **: p<0.01. (B) Regeneration of TH-positive cells at the STR (upper) and the SNC (lower) of lesioned side 18-week after cell therapy. Scale bar: 100 µm. (C). Amplified dopaminergic neuronal circuitry in the lesioned SNC (upper). A comparative normal feature shown in the lower panel. (D) No TH-positive immunoreactivity was found in the lesioned STR (upper panel) and subthalamic nucleus (STN, lower panel) of group (b) and (E) group (c). Arrow: needle track. (F) Presence of GFP-tagged tNSCs (arrow) at the STR (upper panel) and the SNC (lower panel) 18-weeks post-cell therapy.

