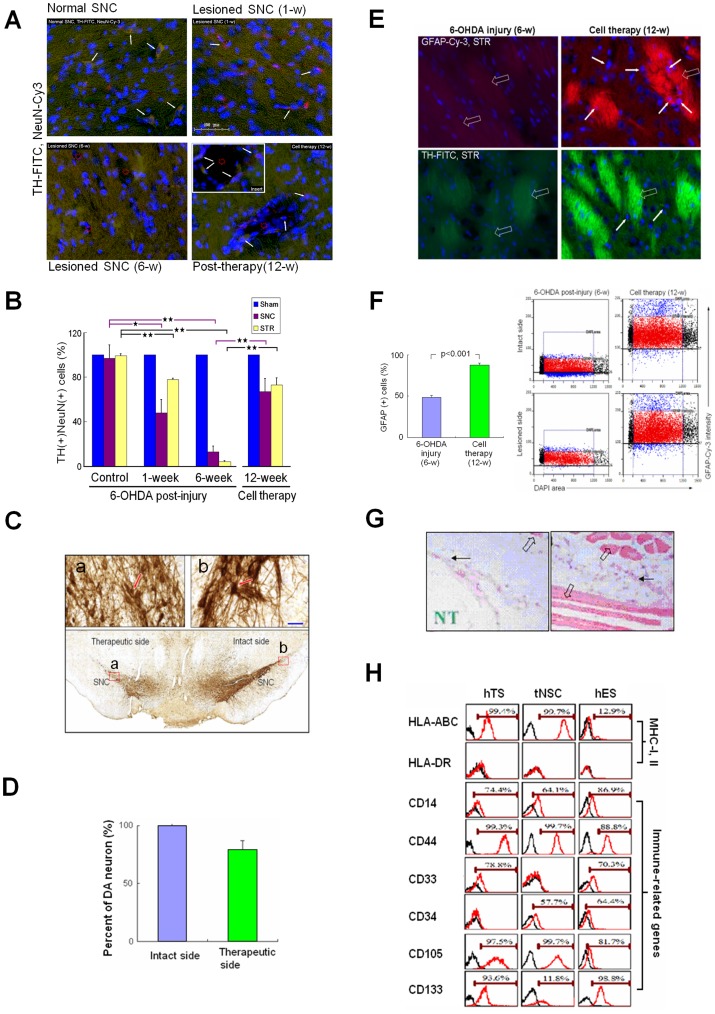
Figure 7. in vivo Regeneration of TH(+) and GFAP(+) Cells with Less Immuno-responses.
(A) Immunohistofluoresence analysis. TH(+) and NeuN(+) motor neurons (arrow) in the SNC of control (left upper). Decreased TH(+) (arrow) at 1-week after 6-OHDA injury (right upper). Apparent reduction in TH(+) neurons with disarrangement of TH-positive neural terminals (green granules), and various degenerative cavity formation (red hollow circle) at 6-week post-injury (left lower). After transplantation at 12-weeks, TH(+) neurons (arrow) at wall of the degenerative cavity (red hollow circle; insert) with TH(+) neural terminals (green color) projecting into the cavity (right lower). (B) Number of TH(+) cells at 1- and 6-weeks reduced to 48% and 13% in the lesioned SNC (red) and 78% and 4% in the lesioned STR (light blue), respectively, post-injury. After transplantation, TH(+) cells re-grew up to 67% and 73% in the lesioned SNC and STR, respectively (right panel). Data analyzed by the software Tissuequest 2.0 (TissueGnostics Gmbh, Vienna, Austria). (C) Regeneration of dopaminergic neurons in the lesioned SNC (lower panel) with amplification (left upper, insert a) compared with the intact side (right upper, insert b). (D) Transplantation of tNSCs at 12-weeks yielded 78% of recovery rate in TH-positive neurons in the lesioned SNC compared to the intact side. Data represent mean ± SD (n = 3). (E) Degeneration of TH-FITC(+) and GFAP-Cy-3(+) Wilson’s pencils (blank arrow) at 6-week post-injury in the lesioned STR (left column). At 12-weeks post-cell therapy (right column), several GFAP(+) cells (arrow) appeared inside the fine fibers of re-established Wilson’s pencils (blank arrow). (F) For immunohistofluorescence imaging analysis, cells were counted in the gate (left scatter plots) determined by the location of cell size (8–10 µm in diameter) and its corresponding intensity of GFAP-Cy-3. Gate (red scatter plot): glial cells counted; black scatter plots: exclusive cells with bizarre size; blue scatter plots: cells with abnormal GFAP intensity. In the STR, the GFAP(+) cells were 65.5% in the lesioned side before treatment and became 93.9% after cell therapy compared to the intact side (right panel). Data represent mean ± SD (n = 3). Student t-test. (G) hTS cells implanted into the SCID mice (n = 6) raised only minor immunoreactions and without tumorigenesis observed. Myxoid-like bizarre cells (black arrow), muscle fibers (blank arrow), and needle track (NT). (H) Flow cytometric analysis of hTS cells, tNSCs, and hES cells. High expression of HLA-ABC in hTS cells and tNSCs, but less in hES cells. No HLA-DR expressed among them. Immune-related gene expressions, including CD14, CD44, CD33, CD34, CD105, and CD133, were compared among them.

