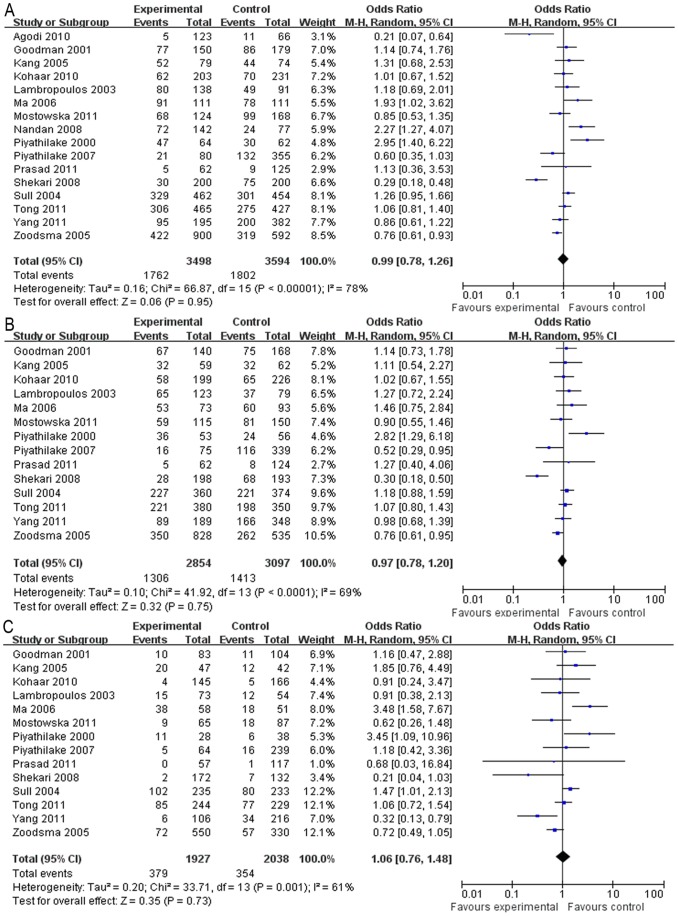
Figure 2. Forest plot describing the association between the C677T polymorphism and the risk of cervical lesions.
(A) Meta-analysis in a random-effects model for CT+TT vs. CC (dominant model). (B) Meta-analysis in a random-effects model for CT vs. CC. (C) Meta-analysis in a random-effects model for TT vs. CC. Each study is shown by the point estimate of the OR (the size of the square is proportional to the weight of each study) and 95% CI for the OR (extending lines).

