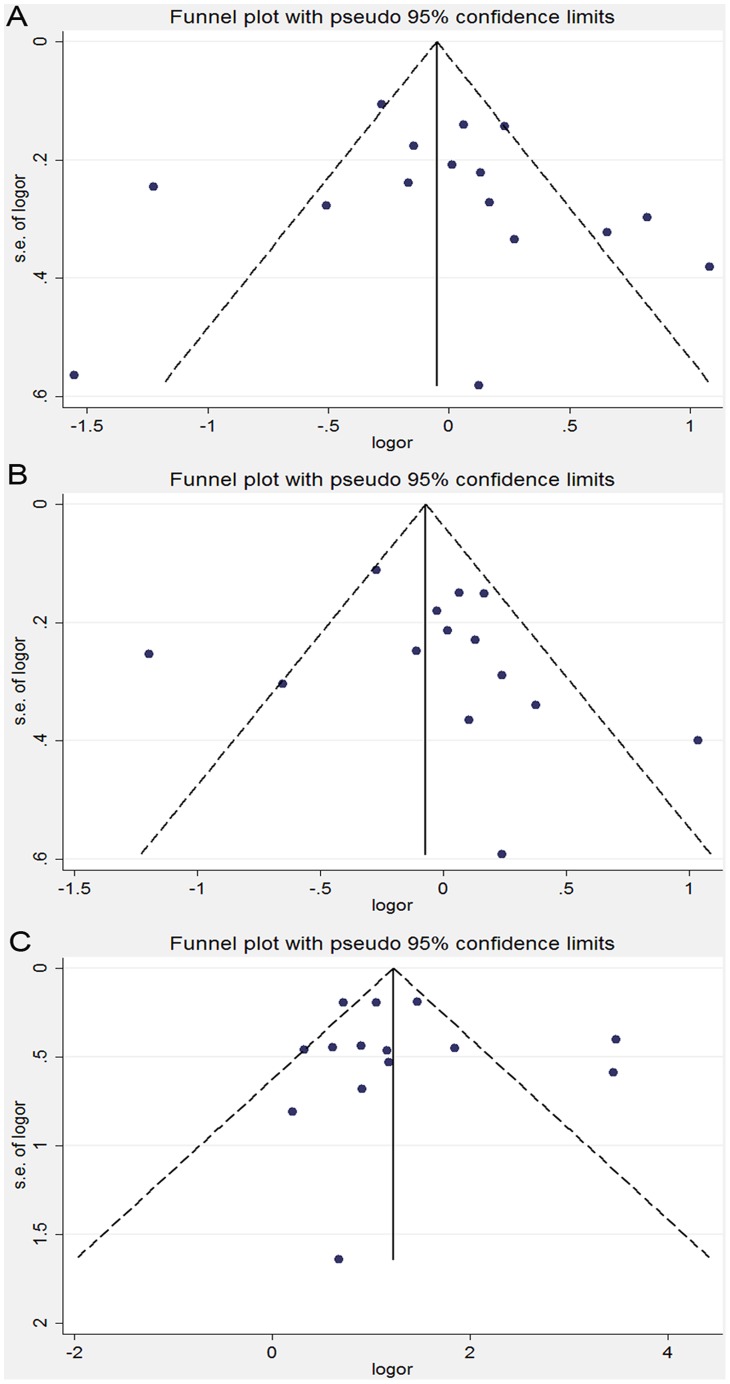
Figure 3. Funnel plot analysis on the detection of the publication bias for the C677T polymorphism.
(A) Meta-analysis in a random-effects model for CT+TT vs. CC (dominant model). (B) Meta-analysis in a random-effects model for CT vs. CC. (C) Meta-analysis in a random-effects model for TT vs. CC. Each point represents an individual study for the indicated association. LogOR, natural logarithm of OR. Perpendicular line denotes the mean effect size.

