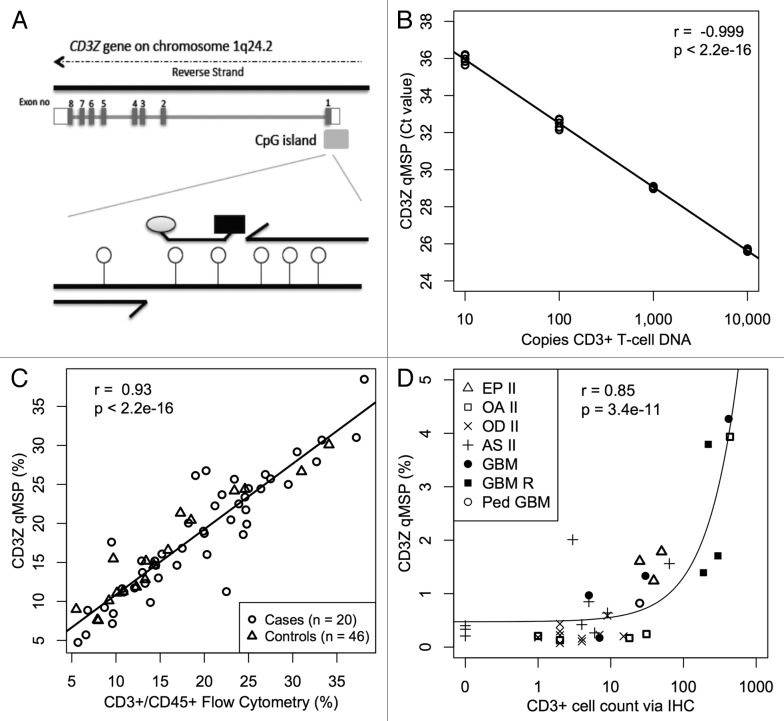
Figure 2.
CD3+ T-cell detection by qMSP. (A) Schematic showing methylation specific primers and probe targeting six CpGs (lollipops) in a region of the CD3Z gene identified as demethylated in CD3+ T-cells. (B) Real time PCR Ct values decrease linearly with 10-fold increase in bisulfite converted CD3+ T-cell DNA concentration. Bisulfite converted universal methylated DNA was used to keep total amount of DNA in all samples constant. At least five replicates of each sample are plotted. (C) Evaluation of CD3+ T-cell level by flow cytometry is highly correlated with T-cell quantification by CD3Z qMSP in whole blood specimens from glioma patients and healthy donors. (D) CD3+ T-cell count by imunohistochemical staining correlates with T-cell quantification by CD3Z qMSP in excised tumors across histological subtypes. Pearson correlations and F-test p values are shown in B‒D.

