
Figure 5.
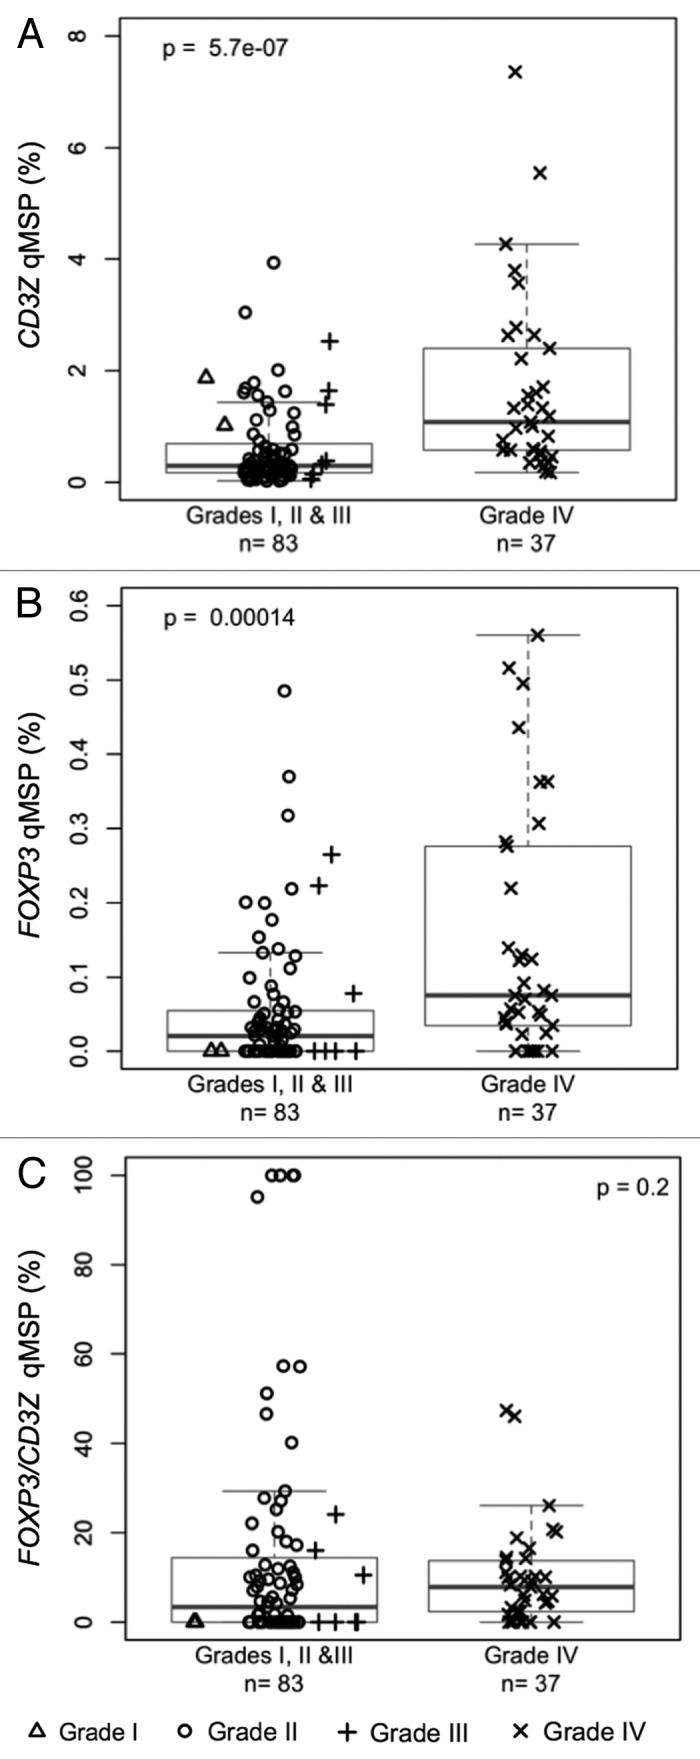
Levels of T-cell and Treg infiltrates in excised glioma tissue. (A) T-cell levels, determined by CD3Z demethylation, in solid glioma samples stratified by tumor grade. (B) Treg levels, determined by FOXP3 demethylation, in solid glioma samples stratified by tumor grade. (C) Treg percent of T-cells, determined by ratio of FOXP3 to CD3Z demethylation, in solid glioma samples stratified by tumor grade. In each panel the displayed p-value is from a Wilcoxon rank sum test between lower grade tumors (Grades I, II and III) and Grade IV tumors. Each data point represents the average of all replicate qMSP measurements for a single individual. Box plots superimposed on the data points cover the 2nd and 3rd quartile range with a line drawn at the median value, and whiskers that extend to 1.5 times the length of the box.