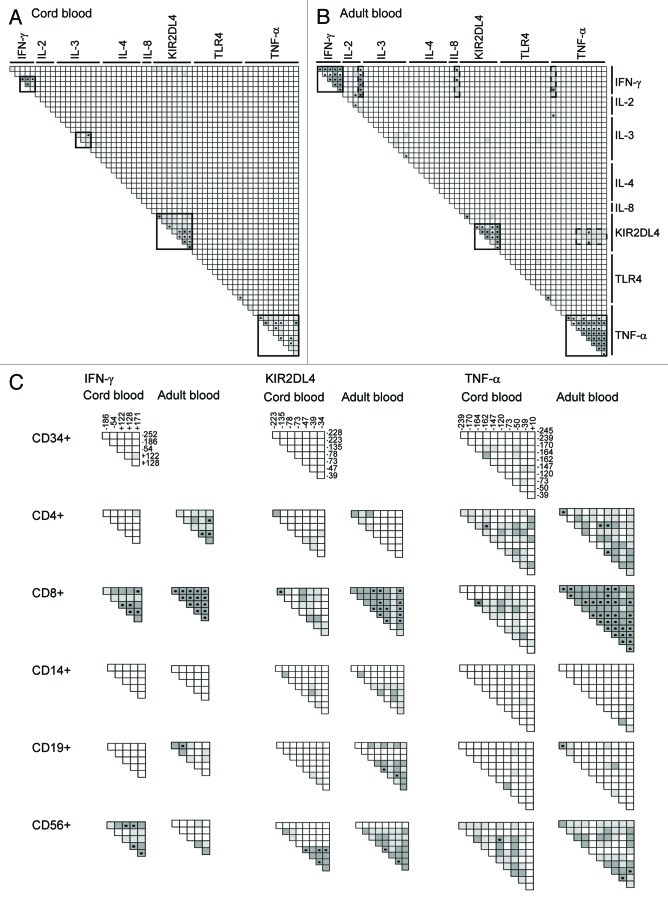
Figure 5. Correlations between methylation levels of individual CpG sites. Spearman correlations between methylation levels in (A) CB, (B) AB, and (C) IFN-γ, KIR2DL4 and TNF-α promoters in different blood cell populations. Clusters of intercorrelated CpG methylation levels were identified by visual analysis of both magnitude and significance (p value) of the Spearman’s correlation coefficient. Light gray squares: 0.6 < rho < 0.8; dark gray squares: rho ≥ 0.8, Dotted squares correspond to p values < 0.000031 (Bonferroni-corrected threshold). Intragenic clusters of intercorrelated methylation levels are delimited by bold black borders. Intergenic clusters are drawn with dashed borders. See Tables S4 and S5 for a detailed view of rho and p values.

An official website of the United States government
Here's how you know
Official websites use .gov
A
.gov website belongs to an official
government organization in the United States.
Secure .gov websites use HTTPS
A lock (
) or https:// means you've safely
connected to the .gov website. Share sensitive
information only on official, secure websites.
