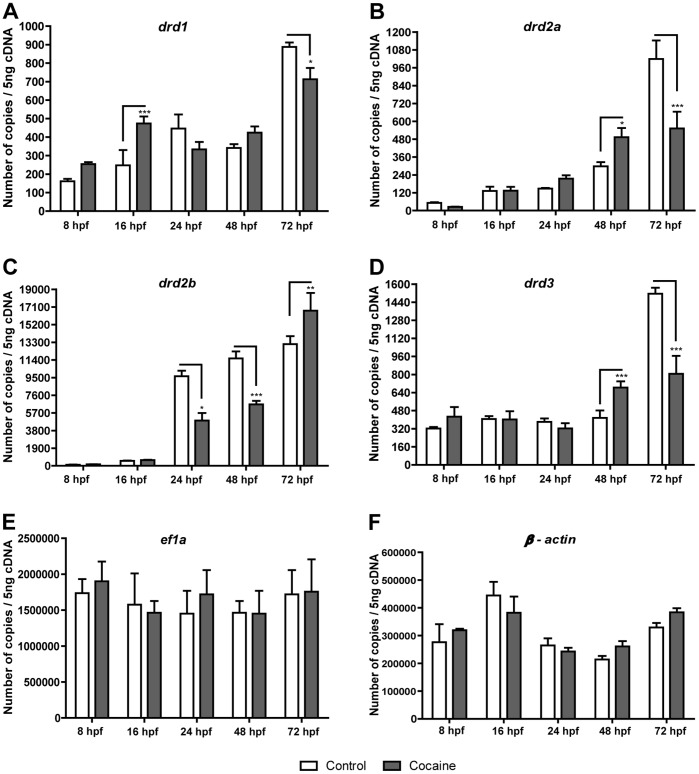
Figure 2. Effects of cocaine on the expression of dopamine receptors.
A) drd1, B) drd2a, C) drd2b and D) drd3 gene expression levels were measured at 8, 16, 24, 48 and 72 hpf using qPCR. All results were normalized to ef1α expression and β-actin (Fig. 2E and F, respectively). Two hundred and fifty embryos were used to extract RNA and synthesize cDNA. Error bars represent means of mRNA copies at each developmental stage ± SEM. Three independent experiments (each performed three times) were conducted for each stage. P values were calculated by two-way ANOVA, with the Bonferroni post-hoc test: *P<0.05, **P<0.01 and ***P<0.001.

