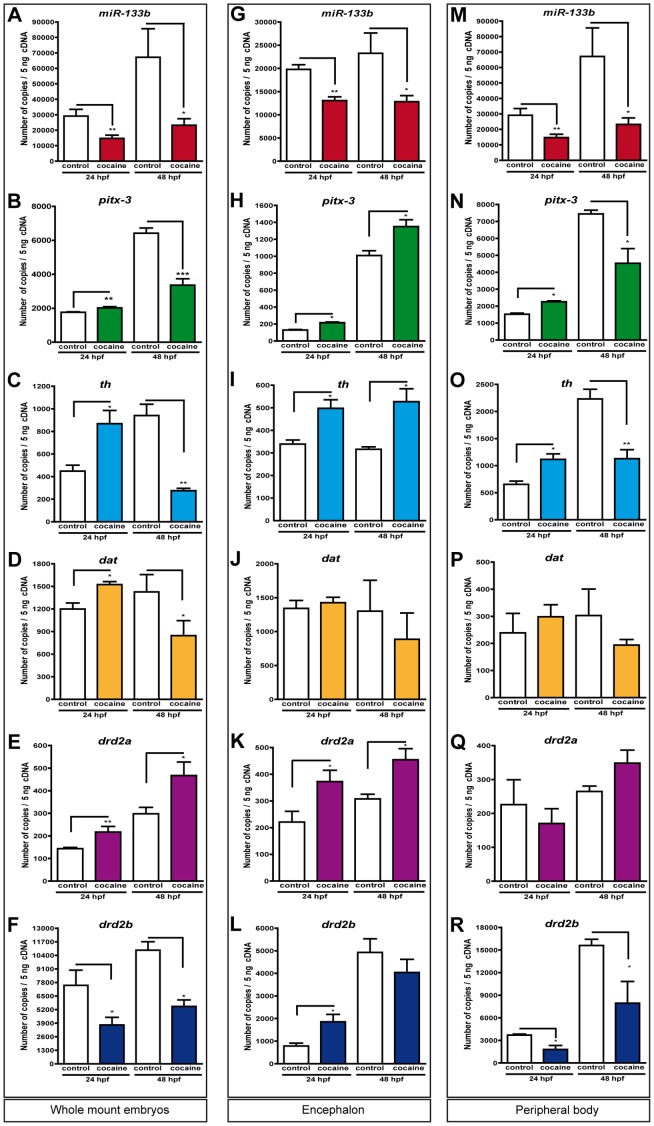
Figure 4. Effects of cocaine on the expression levels of miR-133b, pitx3 and its targets.
Expression of miR-133b, pitx3 and its targets genes (th, dat, drd2a and drd2b) at 24 and 48 hpf in whole-mount embryos (A–F), in the head (G–L) and at the periphery (M–R). Total RNA was isolated from two hundred and fifty embryos and used to synthesize cDNA. Gene expression levels were measured at 24 and 48 hpf by qPCR and were normalized to ef1α expression. Error bars represent means of mRNA copies at each developmental stage ± SEM. Data are representative of three independent experiments and each experiment was performed three times. P values were calculated using two-way ANOVA followed by Bonferroni's post-hoc comparisons tests: *P<0.05, **P<0.01 and ***P<0.001.

