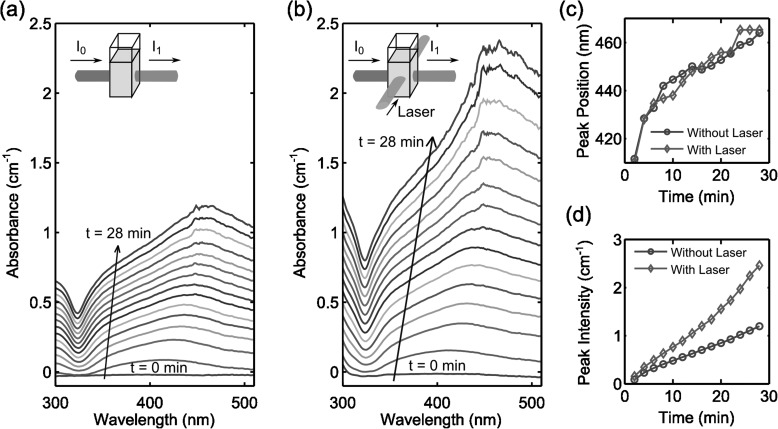
Figure 4.
The absorbance of the mixture of Ag(NH3)2+ and glucose solution (a) without and (b) with 514 nm laser exposure. The insets show the schematic of the experimental setup. (c) The peak position and (d) the peak intensity of the absorbance of the mixture as a function of time without and with laser exposure. The data of (c) and (d) are extracted from (a) and (b).

