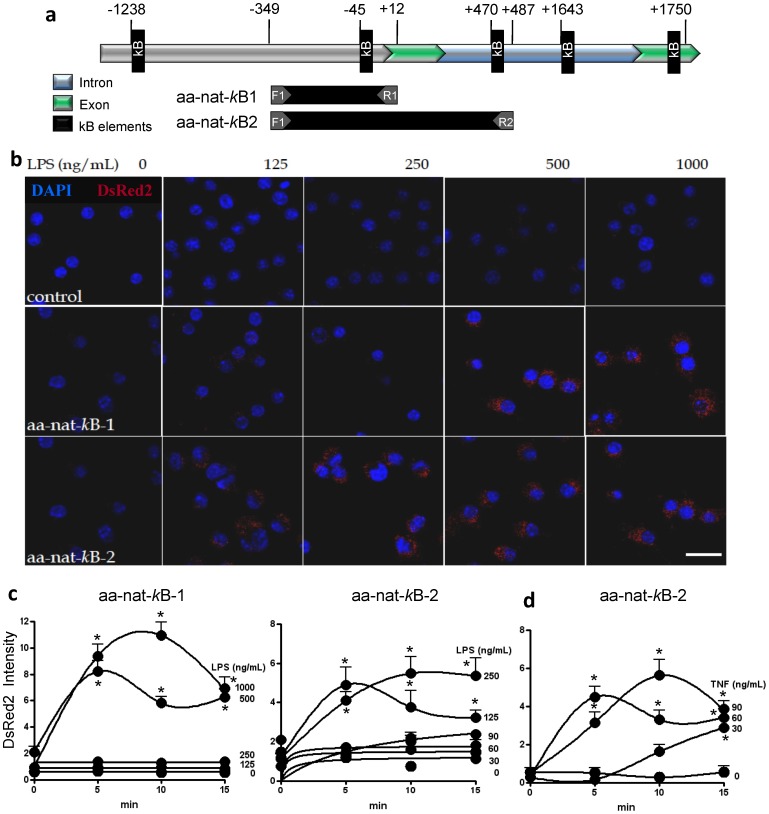
Figure 2. The dose-dependent activation of the aa-nat-promoter by LPS is driven by κB elements.
(a) A schematic representation of the 5′ upstream regulatory region of the rat aa-nat gene indicating the two putative κB elements in the promoter region, two putative κB elements in the first intron and the single κB element in the second exon (black rectangles). The regions included in the aa-nat-κB-1 and aa-nat-κB-2 constructs used in this study are indicated. The aa-nat-κB-1 fragment spanned from 349 bp upstream into promoter to 12 bp downstream of the start of the first exon and contained one κB site (5′-agggggatt-3′) upstream of the first exon (−349), and the aa-nat-κB-2 fragment spanned from 349 bp upstream to 487 bp downstream of the start of the first exon and contained both the above κB site and a second site (5′gggatttgccc 3′inside the first intron. The fragments were inserted into the pDsRed2-1 vector using EcoRI and XhoI restriction sites and the resulting constructs were used to transfect RAW 264.7 macrophages. (b) Confocal microscopy of RAW 264.7 cells transfected with pDsRed2-1-aa-nat-κB-1, pDsRed2-1-aa-nat-κB-2 or pDsRed2-1 control vectors following stimulation with 0, 125, 250, 500 or 1000 ng/mL LPS for 5 min. Red fluorescence demonstrates expression of the DsRed2 reporter protein. Blue fluorescence represents nuclei stained with DAPI. Scale bar = 20 µm. The images are representative of three different randomly chosen fields. The activation of the aa-nat promoter is demonstrated via the quantification of the DsRed2 absolute fluorescence intensities in RAW 264.7 cells transfected with pDsRed2-1-aa-nat-κB1 or pDsRed2-1-aa-nat-κB2 and stimulated with 0, 30, 60, 90, 125, 250, 500 or 1000 ng/mL LPS (c) or stimulated with 0, 30, 60 or 90 ng/mL TNF (d) for different times. The data shown represent the means ± SEM of DsRed2 fluorescence intensity of three independent experiments. For each data point, we counted 30 cells in three different randomly chosen fields.* p<0.05 from LPS zero at the same incubation time.

