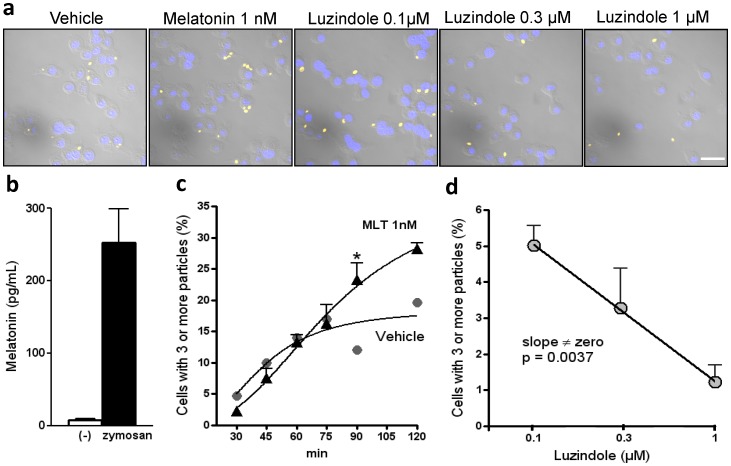
Figure 5. The inhibition of melatonin receptors reduces zymosan phagocytosis by RAW 264.7 macrophages.
(a) Representative confocal microscopy images of RAW 264.7 cells (2×10⁵ cells) exposed to fluorescent zymosan (1×10⁵ particles) for 90 min. The cells were pre-incubated with melatonin (1 nM) or luzindole (0.1, 0.3 or 1 µM) for 30 min. Yellow fluorescence represents fluorescent zymosan. Blue fluorescence represents nuclei stained with DAPI. Scale bar = 20 µm. The images are representative of the three different randomly chosen fields. (b) Melatonin production in RAW 264.7 cells stimulated with (black bar) or without (−) zymosan (20 µg/mL for 6 h; N = 5−6). (c) Phagocytosis of fluorescent zymosan (1×10⁵ particles/2×105 cells) by cells cultured with (black symbols) or without (gray symbols) melatonin (1 nM for 30 min). Each data point represents the mean percent ± SEM of cells with three or more phagocyted particles. For each data point, we counted 30 cells in 3 different randomly chosen fields. (d) The dose-response curve of luzindole inhibition of zymosan phagocytosis. The slope obtained by fitting the curve to a linear equation was significantly different from zero (p = 0.0037).

