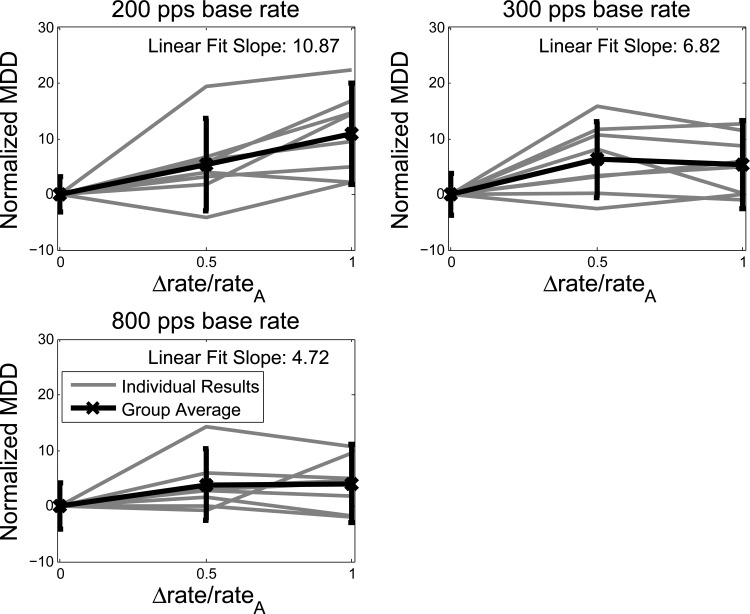
Figure 2.
Normalized minimum detectable delay results. The results for each listener, shown in gray, were normalized by subtracting the within-listener average MDD at a Weber fraction of 0 for the corresponding BR. For the individual listeners, each point is the average of five normalized estimates of the MDD. The group averages are indicated by a thicker black line. Error bars indicate one standard deviation above and below the mean across listeners. For each BR, the slope of the best linear fit, in the least squared sense, to the listener average is given.

