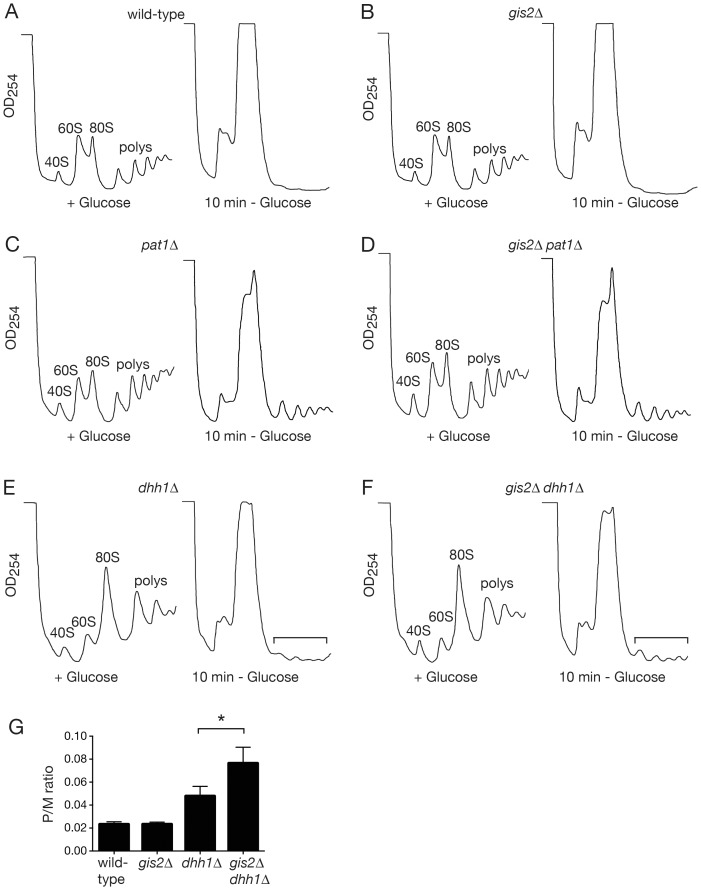
Figure 5. Polysome profiles following glucose deprivation of yeast cells.
(A–F) Wild-type and the indicated mutant strains were grown in glucose-containing media until early logarithmic phase, pelleted, and resuspended in glucose-containing media (left panels) or in media lacking glucose (right panels) and grown for an additional 10 minutes. Lysates were fractionated in 15–50% sucrose gradients and the positions of ribosomal subunits, monoribosomes and polyribosomes detected by monitoring OD254 during collection. (A) wild-type, (B) gis2Δ , (C) pat1Δ, (D) gis2Δpat1Δ, (E) dhh1Δ, (F) gis2Δdhh1Δ cells. To ensure reproducibility, each mutant was analyzed at least twice. (G) The P/M ratio was determined for wild-type, gis2Δ, dhh1Δ and gis2Δ dhh1Δ strains as described [63] following 10 minutes of glucose depletion. P/M ratios for wild-type and gis2Δ strains were determined from three biological replicates, while the P/M ratios for dhh1Δ and dhh1Δ gis2Δ strains were determined from four replicates. Asterisk, p<.05, two-tailed paired t-test.

