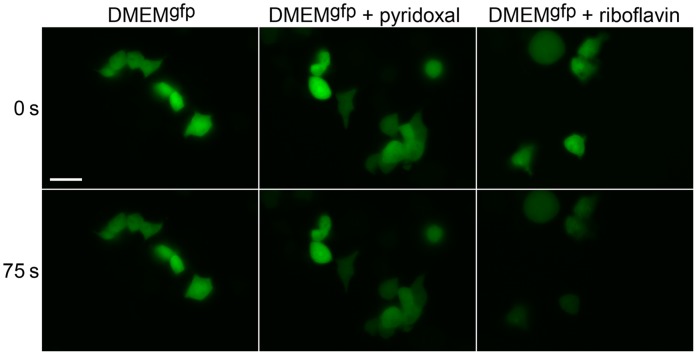
Figure 2. Fluorescence microscopy of live HEK293T cells transiently expressing EGFP.
Representative raw images of cells in green channel used to compose graphs in Figure 1A and B are shown. Cells were imaged in DMEMgfp (left), DMEMgfp with pyridoxal (middle), and DMEMgfp with riboflavin (right) before (upper row) and after (bottom row) 75 s bleaching with intense blue light. Scale bar 20 µm.

