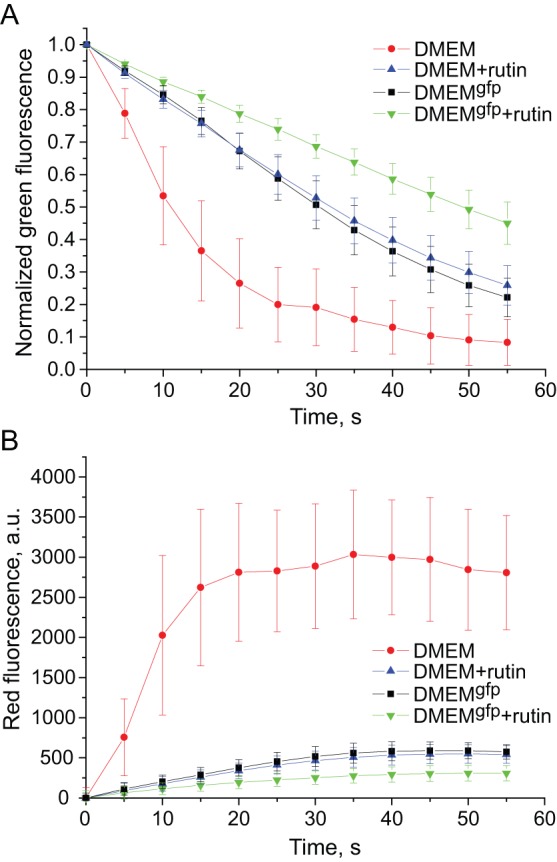
Figure 3. Influence of rutin on EGFP photobehavior.

Graphs show bleaching of green fluorescence (A) and simultaneous appearance of red fluorescence (B) in EGFP-expressing live HEK293 cells maintained in DMEM (red circles), DMEM with rutin (blue triangles), DMEMgfp (black squares), or DMEMgfp with rutin (inverted green triangles). Green fluorescence intensities in individual cells (A) are background subtracted and normalized to maximum (initial) value in each cell. Red fluorescence intensities in the same cells (B) are background subtracted and corrected for initial green fluorescence in respective cells. _Standard deviation values (n = 15–20 cells in a representative experiment out of five independent experiments) are shown.
