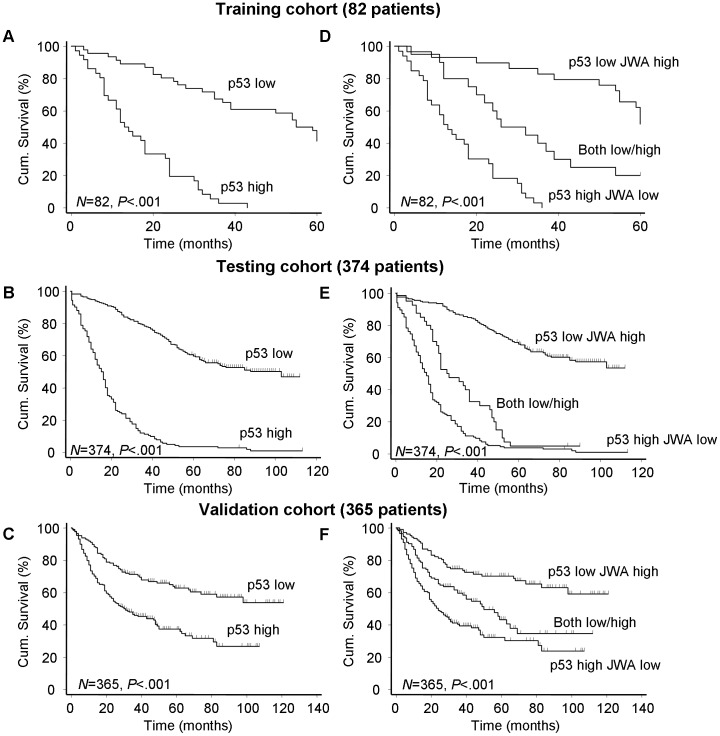
Figure 2. Survival curves according to expression pattern of p53 or p53/JWA in three cohorts.
(A–C) Kaplan-Meier curves depicting overall survival according to expression pattern of p53. (D–F) Kaplan-Meier curves depicting overall survival according to expression pattern of p53/JWA. P values were calculated with the log-rank test.

