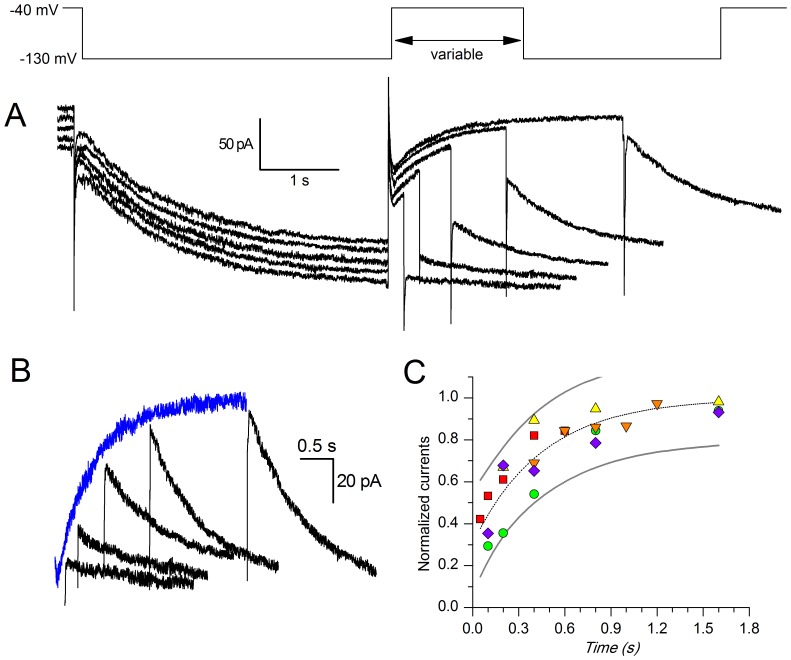
Figure 2. De-activation kinetics.
A: Envelope test during deactivation at −40 mV. After current activation at −130 mV, pulses to −40 mV of variable duration were followed by re-activating steps to −130 mV (see protocol in the top panel). B: The tail at −40 mV was also re-plotted after appropriate scaling (grey trace) to better compare its time course with that of the re-activation records envelope shown in panel A. C: Analysis of the deactivation time constant for a group of five cells; the average time dependence (dashed line) was fitted by the equation I(t) = 1–0.69*exp(-t/0.45) (dashed line; continuous line delimitate the 95% confidence interval).

