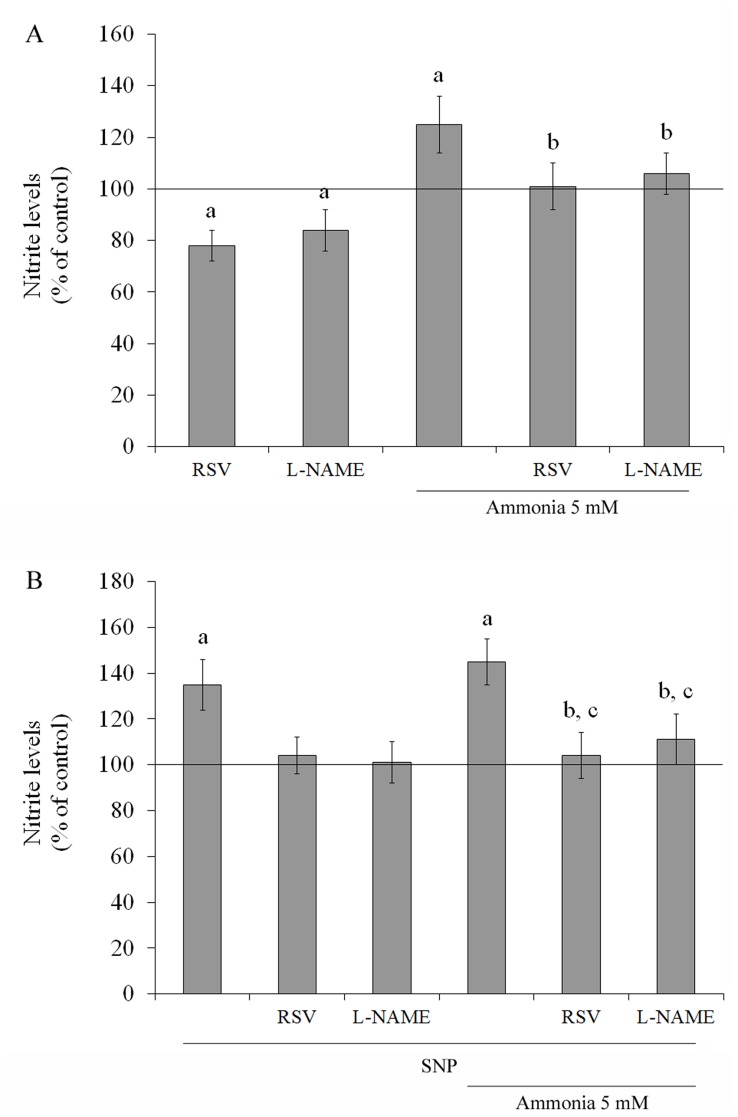
Figure 2. Effects of ammonia and antioxidants on NO levels.
The production of NO was indirectly measured by the formation of nitrite. Cells were incubated for 24 h with 100 µM resveratrol (RSV) or 500 µM L-NAME in the presence or absence of 5 mM ammonia (A). Cells were treated with 40 µM SNP in the presence or absence of 100 µM resveratrol (RSV) or 500 µM L-NAME and 5 mM ammonia, for 24 h (B). Nitrite levels were measured as described in the Materials and methods section. The line indicates the control value. Data represent means ± S.E.M of three experimental determinations performed in triplicate, analyzed statistically by two-way ANOVA followed by the Tukey’s test. (a) Indicates significant differences from the control (P<0.05). (b) indicates significant differences from ammonia (P<0.05). (c) indicates significant differences from SNP (P<0.05).

