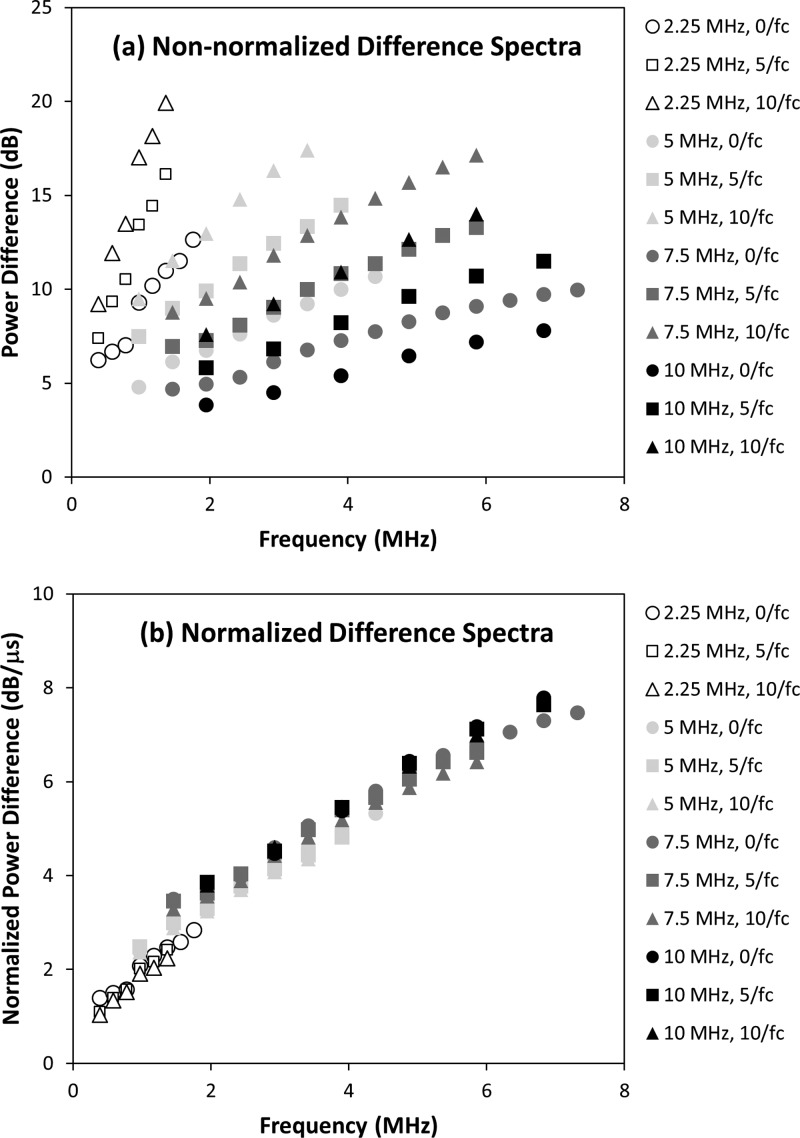
Figure 3.
Results for (a) the difference spectra and (b) the normalized difference spectra for all transducers (2.25, 5, 7.5, and 10 MHz) and all three choices of gate separation (, , and ). Individual data series were generated by averaging all measurements from all specimens for each choice of transducer and gate separation.

