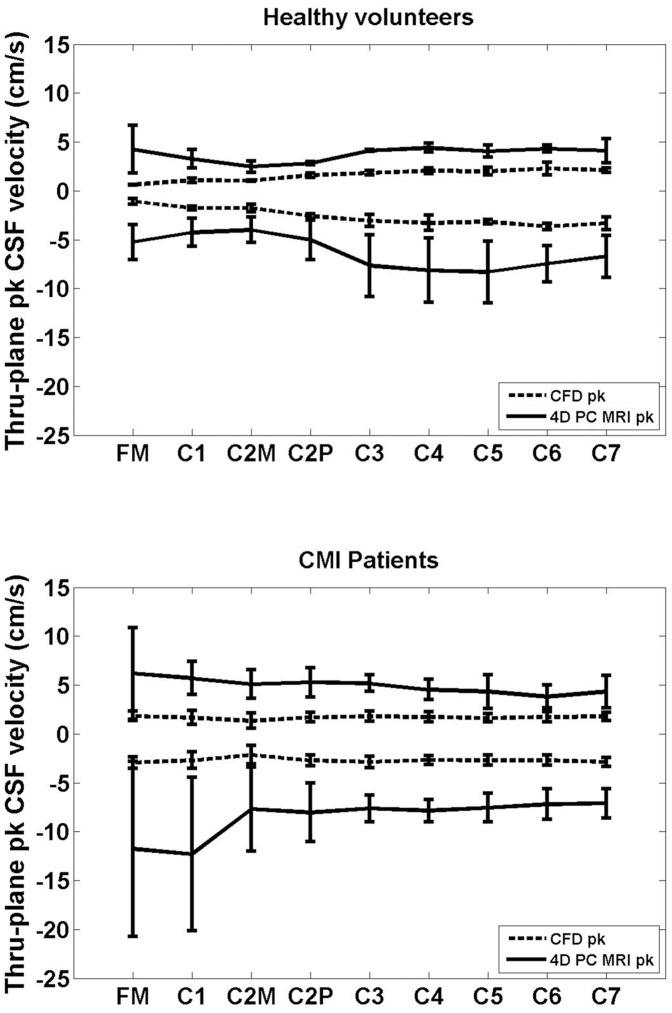
Figure 4. Comparison of the mean thru-plane peak CSF velocities between 4D PC MRI and CFD.
Peak systolic and diastolic velocities were measured by the 4D PC MRI and simulated by CFD in the cervical spine (FM-C7, FM is near the head and C7 is towards the feet) in healthy volunteers (Healthy a, b and c) and CM patients (CM 1, 2, 3, and 4). Values are given as mean ± SD (cm/s) for the three healthy subjects (top) and four CM patients (bottom). Positive (diastolic) and negative (systolic) velocities reflect head and foot directed flow, respectively.

