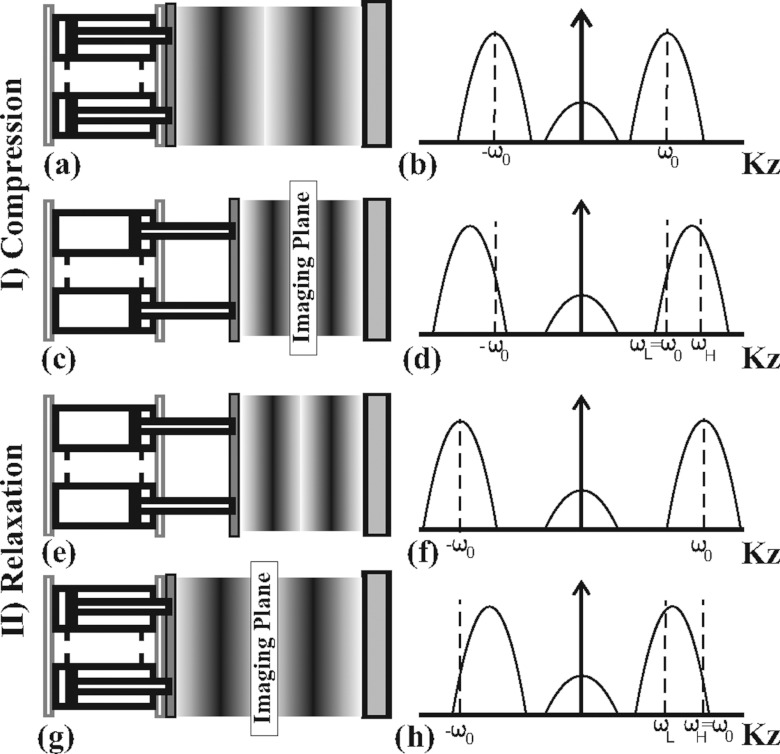
Figure 2.
Demonstration of the tissue status with the tag lines changing for compression [(a)–(d)] and relaxation modes [(e)–(h)] with the corresponding harmonic peak shift (right). (a) The tissue in normal position with initial tagging frequency. (b) Peak sinc pulse profile centered at tagging frequency. (c) Demonstration of the pistons compressing the tissue causing tagging frequency to increase. (d) As a result, harmonic peaks shift to higher frequency. (e) Example of the tissue in compressed state with initial tag lines. (f) Peak sinc pulse profile centered at tagging frequency. (g) Example of the tissue relaxing to normal position causing the tagging frequency to decrease. (h) Harmonic peaks shift to lower frequency.

