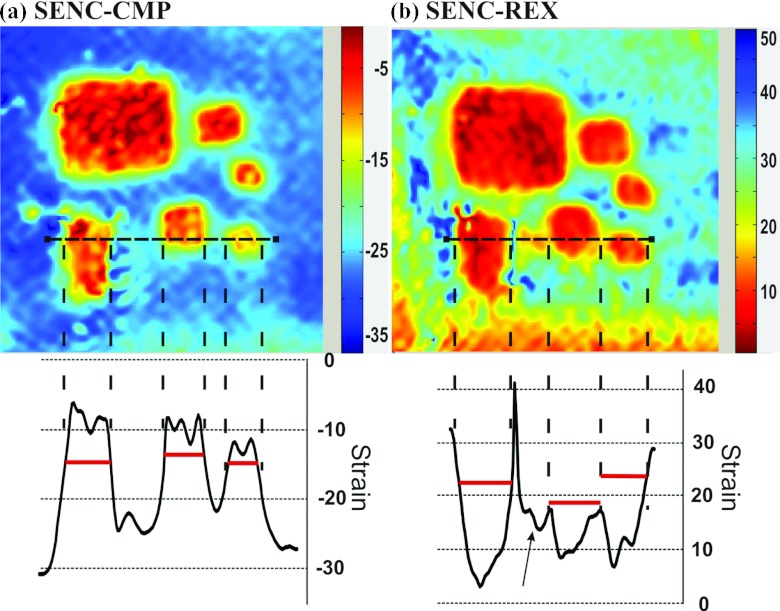
Figure 6.
Magnified images of masses in group A from the phantom demonstrating the excellent spatial resolution of the breast SENC method. (a) SENC-CMP image and (b) SENC-REX image. Strain profile is displayed for the horizontal dotted black line going through three masses for both SENC-CMP and SENC-REX image. Horizontal lines helps determines the masses’ position. Black arrows point to image artifacts that appear on SENC-REX strain profile.

