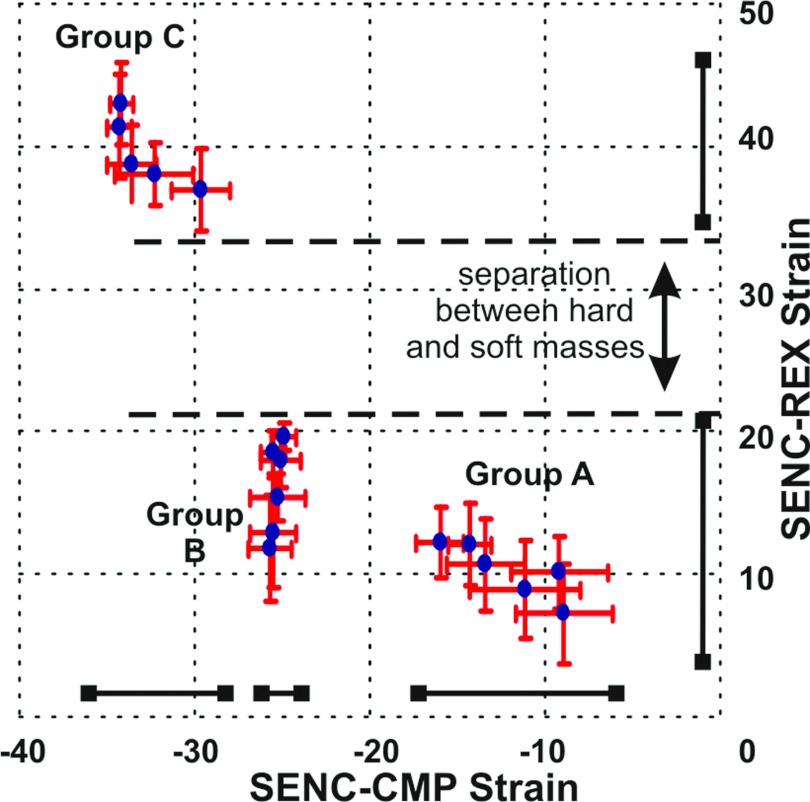
Figure 8.
Cluster plot of the strain (mean ± standard deviation) for each mass measured from the SENC breast MRI. The X-axis is the compression strain, while the Y-axis is the relaxation strain. The masses are clearly clustered into three groups according to their stiffness. SENC-CMP could separate masses into three groups, while SENC-REX separates hard masses from soft ones with large separation.

