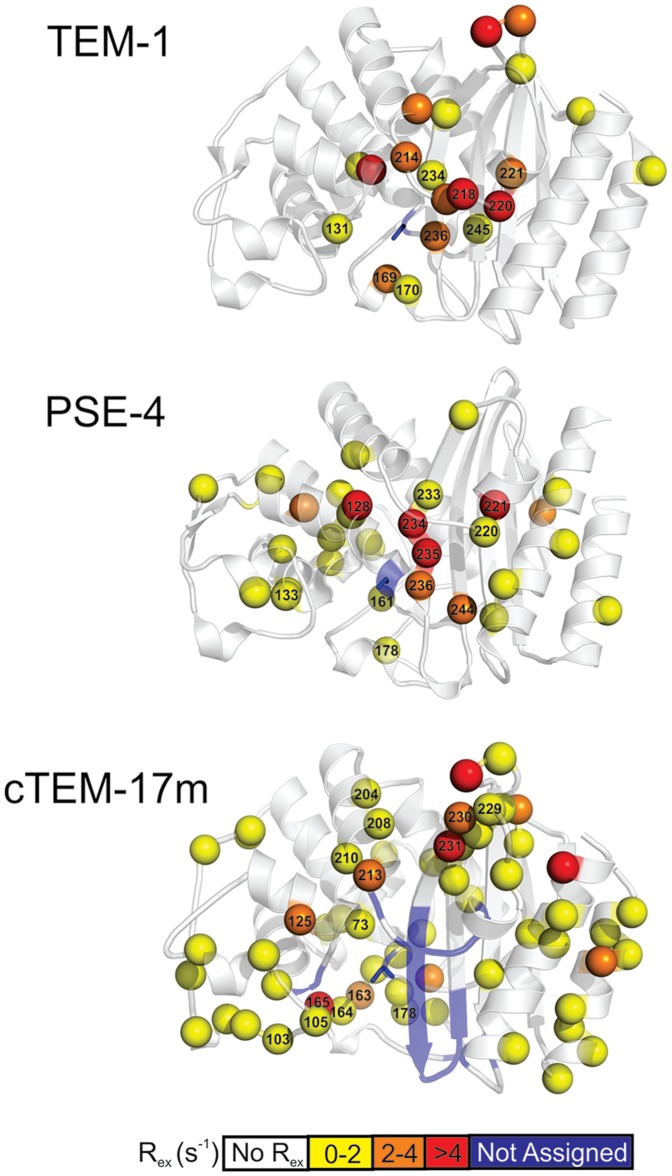
Figure 5. Comparison of slow motions for the parental and chimeric enzymes.
Residues for which the conformational exchange term Rex was extracted from model-free models m3, m4, m7, m8, or m9, indicative of dynamics on the µs-ms timescale, were scaled to the same field (600 MHz) and mapped as spheres for TEM-1 [23], PSE-4 [24] and cTEM-17m. The spheres are colored according to the magnitude of Rex, as defined in the scale below. Residues for which backbone NMR assignments are missing, potentially indicating the presence of µs-ms motions, are in blue. The active-site serine is in sticks representation.

